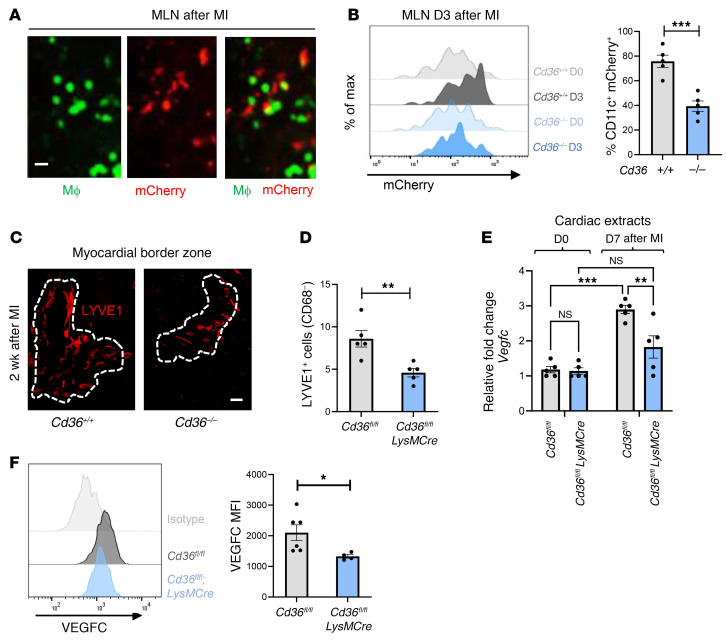
Figure 1. Bone marrow–derived Cd36 is required for both the accumulation of cardiac antigens in MLNs and increased tubular LYVE1 staining after MI.
(A) Imaging of murine MLN cross-sections 3 days after ligation of the LAD artery. Macrophages (MΦ) from LysMCre-EGFP mice show EGFP signal, and cardiomyocyte debris from Myh6-mCherry–transgenic mice show red signal. Scale bar: 40 μm. (B) Chimeric Myh6-mCherry mice, deficient for bone marrow–derived Cd36, were subjected to coronary artery occlusion. Three days after MI (D3), MLNs were harvested, and flow cytometric analysis of Ly6g–CD11b+CD11c+ cells was performed. n = 5 per group. max, maximum. ***P < 0.0005, by 2-tailed, unpaired t test. (C) C57BL/6 mice were subjected to MI via coronary occlusion of the LAD artery. Representative immunofluorescence images were taken from 2 weeks after MI. Data display tubular LYVE1+ staining of the myocardial infarct border zone in Cd36–/– mice versus Cd36+/+ mice. Scale bar: 125 μm. (D) Border zone quantification of LYVE1+CD68– nuclei in Cd36fl/fl versus Cd36fl/fl LysMCre mice after MI. n = 5 per group. **P < 0.007, by 2-tailed, unpaired t test. (E) qPCR analysis of myocardial Vegfc in Cd36-deficient mice after MI. n = 5 per group. **P < 0.005 and ***P < 0.0001, by 2-way ANOVA followed by Tukey’s test. (F) Expression of VEGFC in cardiac macrophages with myeloid-specific deletion of Cd36 compared with controls 7 days after MI. n = 4–6 mice per group pooled from 2 independent experiments. *P < 0.05, by 2-tailed, unpaired t test.

