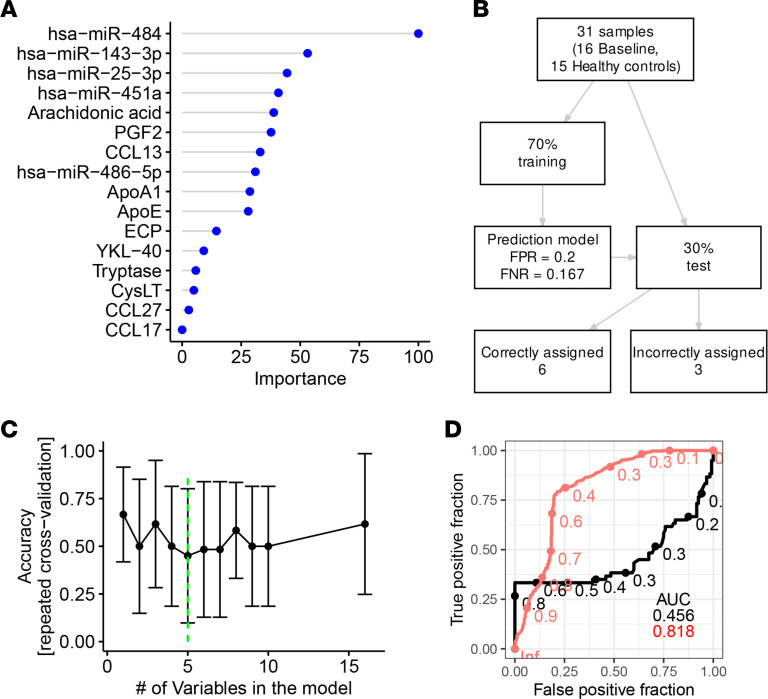
Figure 6. Serological biomarkers show potential to predict patients at risk of anaphylaxis.
(A) Feature importance score using a random forest algorithm with all potential biomarkers. (B) Flowchart for the modeling procedure, including model evaluation using repeated cross-validation. FPR, false positive rate; FNR, false negative rate. (C) Automatic selection of best features out of th e 17 initial ones reported in A using recursive feature elimination algorithm. (D) ROC AUC in a random forest model with 5 predictors (hsa-miR-484, hsa-miR-25-3p, hsa-miR-451a, apolipoprotein E, and YKL-40 — red curve) compared with a model including tryptase, apolipoprotein A1, and PGF2 — black curve.

