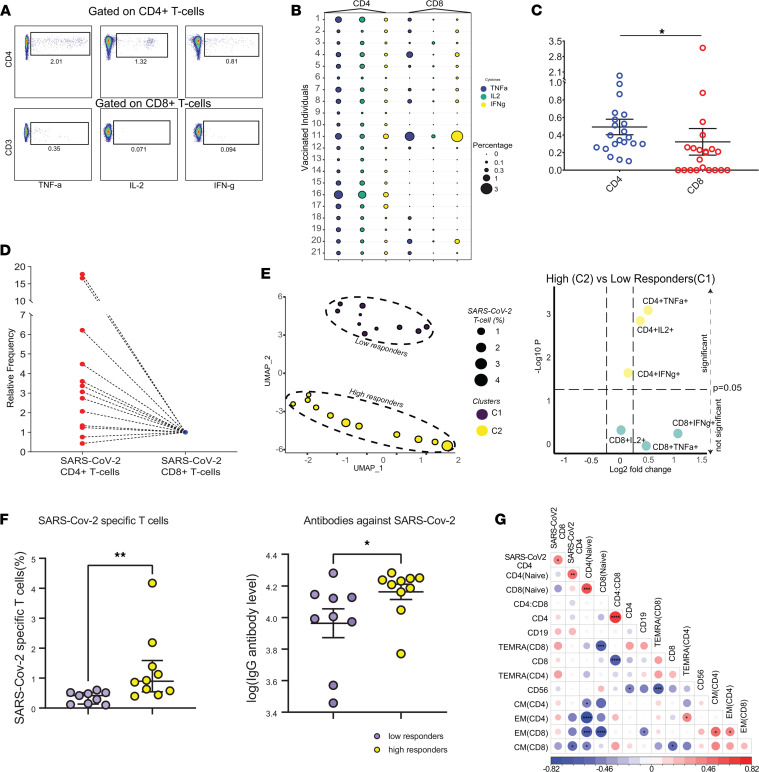
Figure 2. SARS-CoV-2 vaccination induces a CD4+ T cell–dominant immune response.
(A) Representative FACS plots summarize cytokine production (TNF-α, IL-2, and IFN-γ) from CD4+ and CD8+ T cells in 1 of 21 donors. (B) The bubble plot shows the percentage of TNF-α–, IL-2–, and IFN-γ–secreting CD4+ and CD8+ T cells in 21 vaccinated individuals. The colors indicate cytokine and the size represents cytokine percentage per CD4 or CD8. (C) The bar plot shows the frequency of SARS-CoV-2–specific CD4+ and CD8+ T cells. Error bars represent mean ± SEM. (*P < 0.05 by Wilcoxon paired t test, n = 21.) (D) The relative percentages of SARS-CoV-2–specific CD4+ and CD8+ T cells in 13 individuals having detectable SARS-CoV-2–specific CD8+ T cells. (E) UMAP dimension and clusters identify differential response to vaccination (left). Volcano plot (right) shows the differentially expressed cytokines between C1 and C2 (Mann-Whitney U test, n = 21). (F) Plots show the comparison of SARS-CoV-2–specific T cells and IgG antibody level between low and high responders (*P < 0.05, **P < 0.01, unpaired t test, n = 21). Plots show the frequencies of SARS-CoV-2–specific T cells (CD4+ and CD8+) and the levels of S-protein–specific IgG. (G) The Spearman’s correlation matrices of immune features extracted from 21 vaccinated individuals (*P < 0.05, **P < 0.01, ***P < 0.001,****P < 0.0001, Wilcoxon paired t test, n = 21).

