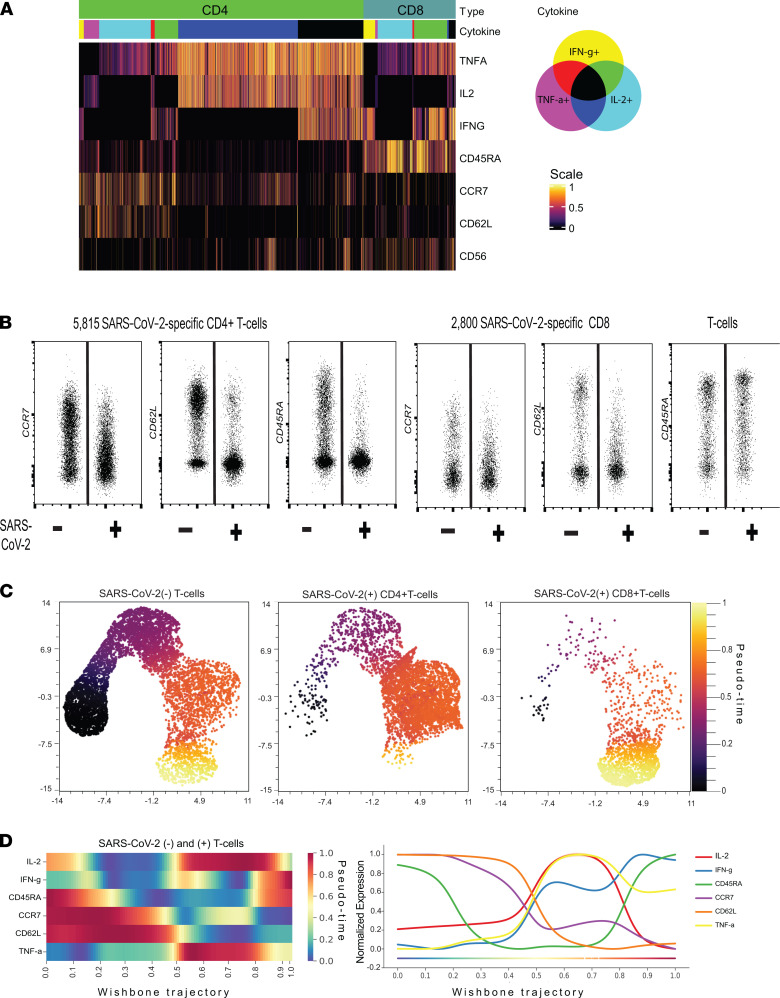
Figure 4. Phenotypic and evolutionary traits of vaccine-induced SARS-CoV-2–specific T cells.
(A) Heatmap shows the expression of cytokines and differentiation markers of SARS-CoV-2–specific CD4+ and CD8+ T cells. The color bar indicates subsets producing different combinations of cytokines, and the scale bar shows the scaled expression level. (B) Dot plot shows the expression of CCR7, CD62L, and CD45RA in concatenated SARS-CoV-2–specific CD4+ (left) and CD8+ (right) T cells from 21 vaccinated individuals. (C) SARS-CoV-2–specific CD4+ (middle) and CD8+ (right) T cells and equal number of SARS-CoV-2– T cells (left) were pooled and subjected to UMAP dimension reduction, and differentiation state of each single cell was inferred through pseudotime analysis. Pseudotime values are shown for each single cell. (D) Trend plots (left) and lines (right) show the expression levels of differentiation markers and cytokines along the pseudotime. Color scale indicates the scaled expression levels.

