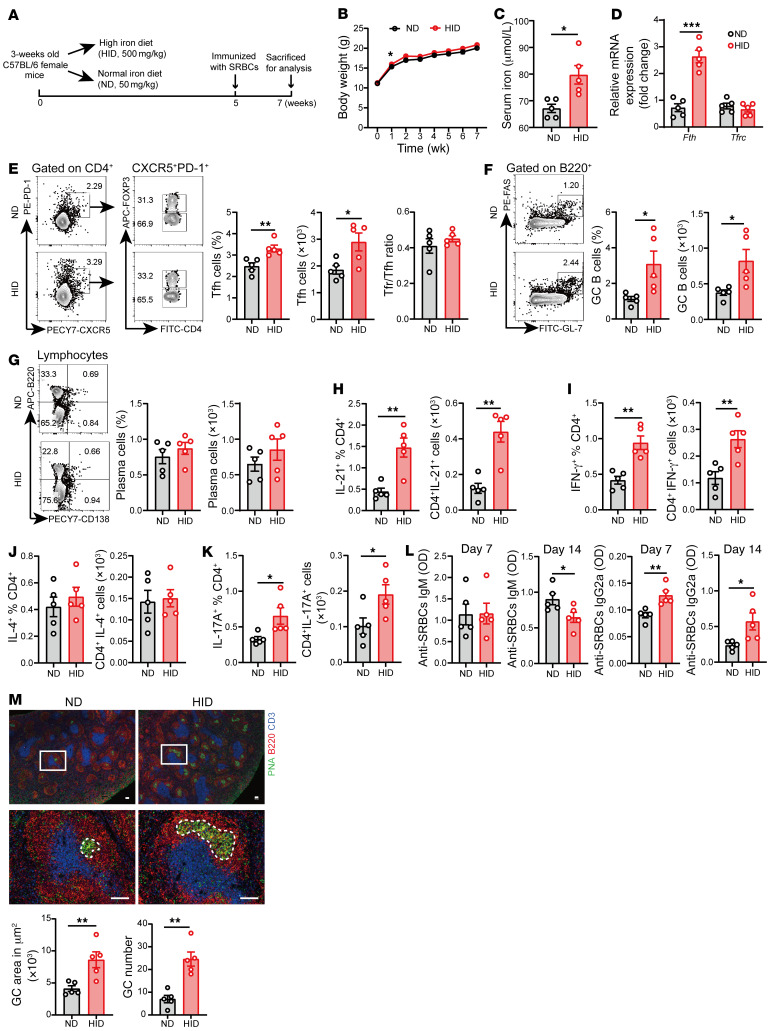
Figure 3. HID promotes exogenous antigen-induced GC response.
3-week-old female B6 mice were treated with a normal iron diet (ND, 50 mg/kg, n = 5) and a high-iron diet (HID, 500 mg/kg, n = 5) for 5 weeks and immunized with sheep red blood cells (SRBCs) by i.p. injection. Mice were sacrificed for analysis after 2 weeks of immunization. (A) Schematic diagram of the HID treatment and SRBC immunization. (B) Body weight change of mice treated with ND or HID. (C) The level of serum iron in mice treated with ND or HID. (D) mRNA expression of Fth and Tfrc in splenic CD4+ T cells of ND- or HID-treated mice. (E) Representative flow cytometry and quantification of CD4+CXCR5+PD-1+ Tfh cells and CD4+CXCR5+PD-1+Foxp3+ Tfr cells. (F) Representative flow cytometry and quantification of B220+GL-7+FAS+ GC B cells. (G) Representative flow cytometry and quantification of B220–CD138+ plasma cells. (H–K) Quantification of the percentage and numbers of (H) CD4+IL-21+ cells, (I) CD4+IFN-γ+ cells, (J) CD4+IL-4+ cells, and (K) CD4+IL-17A+ cells. (L) Serum levels of anti-SRBC IgM and anti-SRBC IgG2a in ND- and HID-treated mice at day 7 and day 14 of SRBC immunization. (M) Representative histology and quantification of GCs in the spleen after 2 weeks of SRBC immunization. Blue, CD3; red, B220; green, PNA. Scar bar: 100 μM. Cells were isolated from the spleens of ND- and HID-treated mice immunized with SRBCs. Data are shown as mean ± SEM. Data are representative of 2 independent experiments. *P < 0.05, **P < 0.01, ***P < 0.001 (unpaired 2-tailed Student’s t test for B–M).

