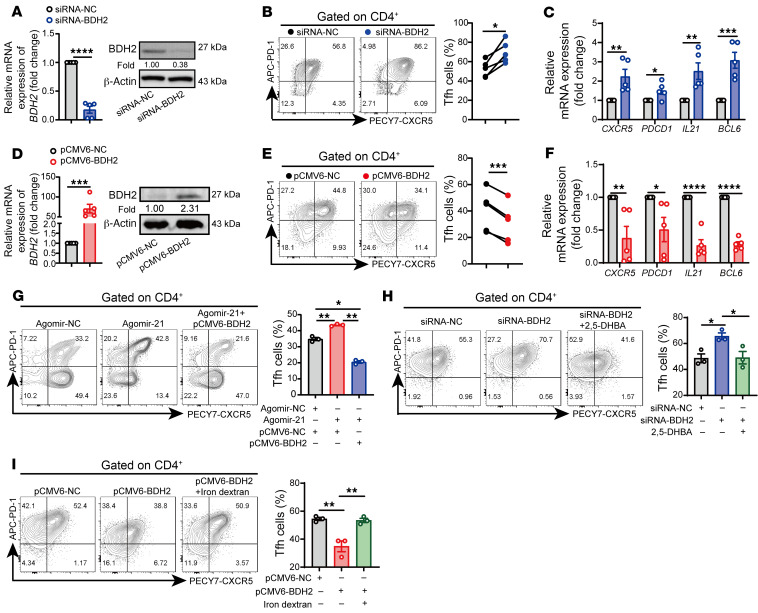
Figure 8. BDH2 is the target gene of miR-21 in regulation of Tfh cells.
(A–C) Healthy naive CD4+ T cells were transfected with siRNA-NC or siRNA-BDH2 and then cultured under Tfh cell–polarized conditions for 3 days (n = 5). After 3 days of stimulation, (A) qPCR and Western blot of BDH2, (B) flow cytometry and quantification of CD4+CXCR5+PD-1+ Tfh cells, and (C) qPCR of CXCR5, PDCD1, IL21, and BCL6 were analyzed. (D–F) Healthy naive CD4+ T cells were transfected with pCMV6-NC or pCMV6-BDH2 and then cultured under Tfh cell–polarized conditions for 3 days (n = 5). (D) qPCR and Western blot of BDH2, (E) flow cytometry and quantification of CD4+CXCR5+PD-1+ Tfh cells, and (F) qPCR of CXCR5, PDCD1, IL21, and BCL6 were analyzed. (G) Representative flow cytometry and quantification of induced Tfh cells in cells transfected with Agomir-NC, Agomir-21, and Agomir-21 plus pCMV6-BDH2 (n = 3). (H) Representative flow cytometry and quantification of CD4+CXCR5+PD-1+ Tfh cells in cells transfected with siRNA-NC, siRNA-BDH2, and siRNA-BDH2 plus 2,5-DHBA (n = 3). (I) Representative flow cytometry and quantification of CD4+CXCR5+PD-1+ Tfh cells in cells transfected with pCMV6-NC, pCMV6-BDH2, or pCMV6-BDH2 with iron dextran (n = 3). Data are shown as mean ± SEM. Data are representative of at least 2 independent experiments with 3–5 donors. *P < 0.05, **P < 0.01, ***P < 0.001, ****P < 0.0001 (2-tailed Student’s t test for A–F and 1-way ANOVA with Tukey’s multiple-comparisons test for G–I).

