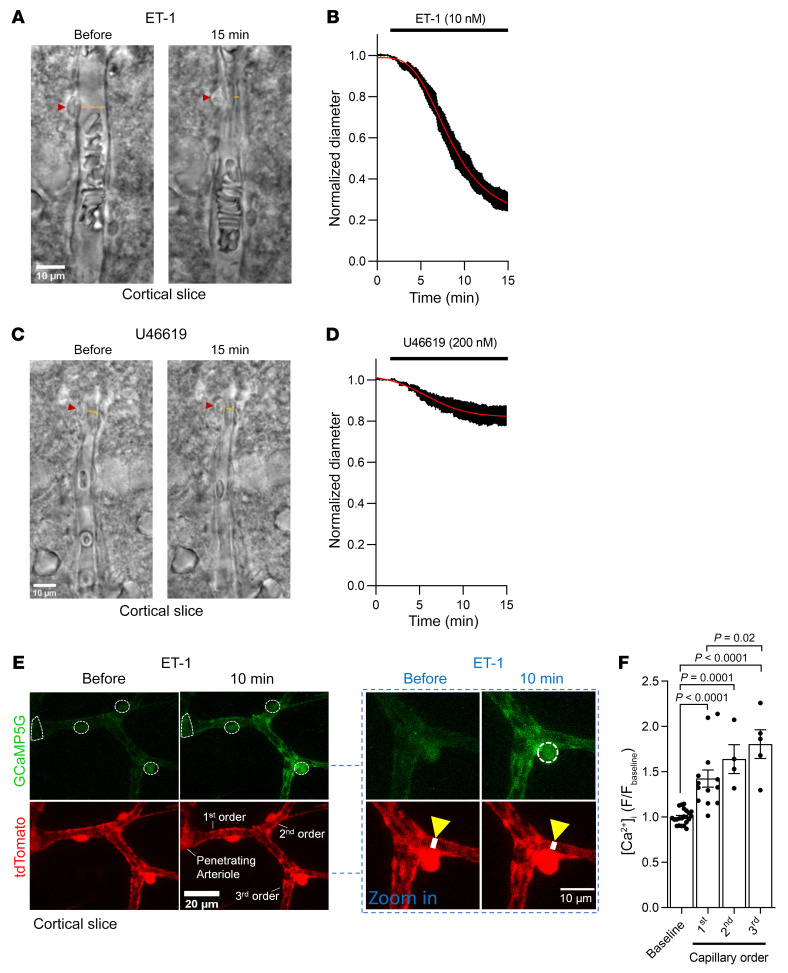
Figure 2. Vasoconstricting GqPCR agonists raise pericyte [Ca2+]i and constrict capillaries at pericyte somata in acute cortical slices.
(A) Representative bright-field images of a live rat cortical capillary pericyte before and after 15 minutes exposure to endothelin 1 (ET-1; 10 nM). Red arrowheads indicate the pericyte soma, and yellow lines indicate where the internal capillary diameter was measured. Scale bar: 10 μm. (B) Mean internal capillary diameter at pericyte somata during exposure to ET-1 (10 nM), normalized to the diameter measured in the absence of ET-1 (n = 10). The ET-1–evoked capillary constriction was not dependent on the sex of rats (Supplemental Figure 3A). (C) Representative bright-field images of a live capillary pericyte, as in A. The thromboxane A2 analog U46619 (200 nM) was applied. Scale bar: 10 μm. (D) Mean internal capillary diameter at pericyte somata during exposure to U46619 (200 nM), normalized to the diameter measured in the absence of U46619 (n = 8). (E) Two-photon microscopy images (maximum intensity projections) of SMCs on a PA and pericytes on first- to third-order capillary branches in acute cortical slices obtained from NG2-CreERT2-GCaMP5G mice. ET-1 raised the somatic [Ca2+]i of SMCs and pericytes (encircled with white dashed lines). Scale bar: 20 μm. The pericyte [Ca2+]i rise coincides with capillary constriction, as indicated by the white line across the vessel lumen in the higher magnification image (scale bar: 10 μm). (F) ET-1 significantly raises [Ca2+]i in first- to third-order pericyte somata and evoked the greatest [Ca2+]i rise in third-order pericytes. The mean GCaMP5G fluorescence in pericyte somata (points indicate individual pericytes from 5 mice; baseline, n = 22; first, n = 13; second, n = 4; third, n = 5) was normalized to the mean GCaMP5G fluorescence of the 17 minutes baseline (Fbaseline) with aCSF (1-way ANOVA with Tukey’s post hoc test).

