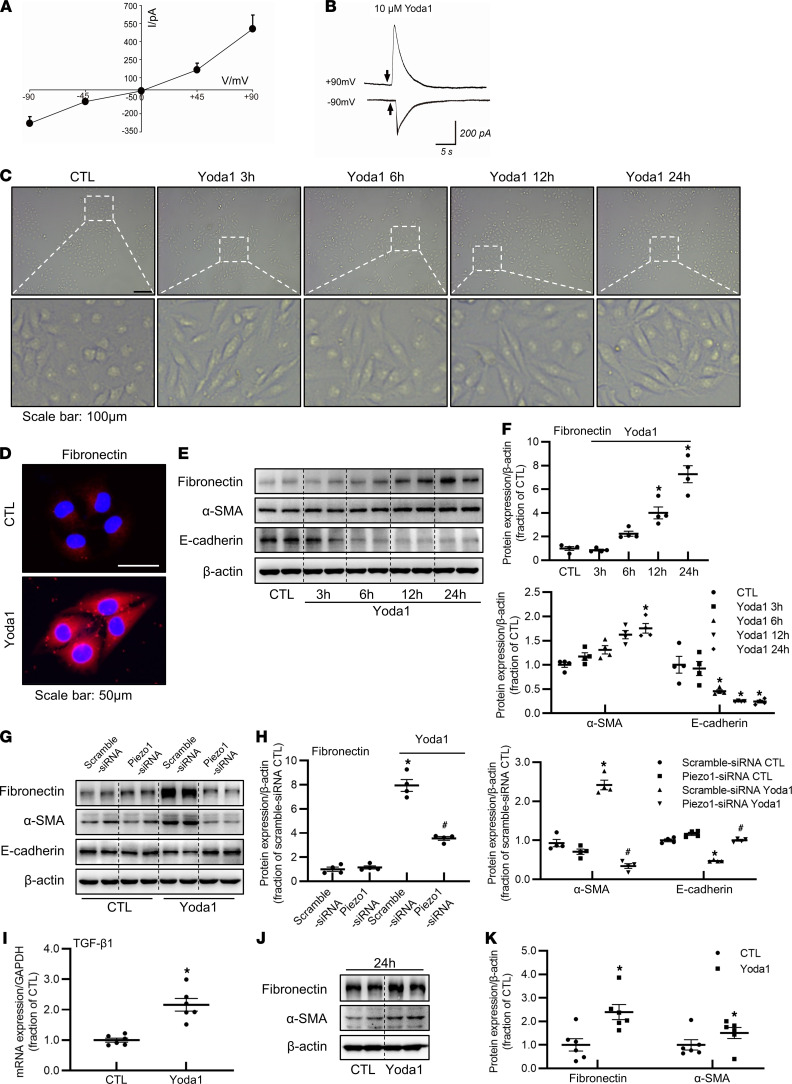
Figure 8. Activation of Piezo1 by an agonist, Yoda1, induces profibrotic responses in HK2 cells and mPTCs.
(A and B) Yoda1 induced the cationic currents in HK2 cells. (A) I-V curve exhibited the currents activated by 10 μM Yoda1 recorded at different membrane potentials in voltage-clamp mode. (B) Representative traces: recorded at –90 and +90 mV by puffing 10 μM Yoda1 (short black arrow) for 350 ms to HK2 cells. (C) Morphologic changes of HK2 cells treated with Yoda1 for 3 hours, 6 hours, 12 hours, and 24 hours. Scale bar: 100 μm. (D) Immunofluorescence of fibronectin in HK2 cells treated with Yoda1 for 24 hours. Scale bar: 50 μm. (E and F) Representative immunoblots and corresponding densitometry analysis of fibronectin, α-SMA, and E-cadherin protein abundance in HK2 cells treated with Yoda1 for 3 hours, 6 hours, 12 hours, and 24 hours. Data are shown as mean ± SEM (n = 4 in each group). *P < 0.05 when compared with CTL by 1-way ANOVA with Student-Newman-Keuls test. (G and H) Representative immunoblots and corresponding densitometry analysis of fibronectin, α-SMA, and E-cadherin protein abundance in HK2 cells transfected with Piezo1 siRNA followed by Yoda1 treatment for 24 hours. Data are shown as mean ± SEM (n = 4 in each group). *P < 0.05 when compared with scramble siRNA CTL and #P < 0.05 when compared with scramble siRNA Yoda1 by 1-way ANOVA with Student-Newman-Keuls test. (I) mRNA expression of TGF-β1 in HK2 cells treated with Yoda1 for 24 hours. Data are shown as mean ± SEM (n = 6 in each group). *P < 0.05 when compared with CTL by unpaired Student’s t test. (J and K) Representative immunoblots and corresponding densitometry analysis of fibronectin and α-SMA protein abundance in primary cultured mPTCs treated with Yoda1 for 24 hours. Data are shown as mean ± SEM (n = 6 in each group). *P < 0.05 when compared with CTL by unpaired Student’s t test. CTL, control; SMA, smooth muscle actin; TGF-β1, transforming growth factor-β1; mPTCs: mouse proximal tubular cells.

