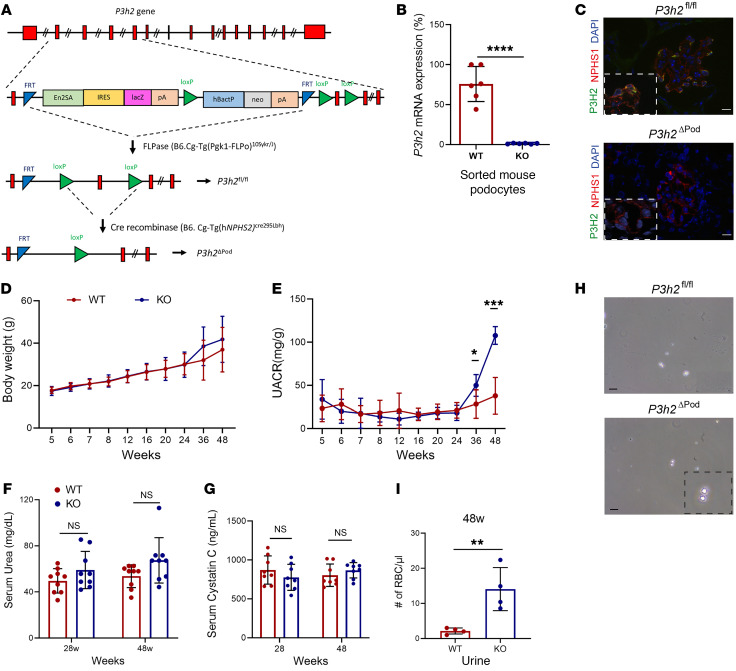
Figure 2. Generation and characterization of P3h2ΔPod mice by urinalysis.
(A) Schematic strategy for the generation of P3h2ΔPod mice. (B) KO confirmation of the P3h2ΔPod mice. qPCR P3h2 mRNA expression analysis was performed in sorted podocytes from WT and KO mice. P3h2 mRNA levels were reduced by 99% in P3h2ΔPod mice compare with levels in P3h2fl/fl mice. (C) Immunofluorescence staining of WT and KO kidney tissues for P3H2, NPHS1, and DAPI. There was no detectable P3H2 in the P3h2ΔPod mouse podocytes. Scale bar: 10 μm; inset zoom, ×5. (D) Body weights of P3h2ΔPod and P3h2fl/fl mice were measured starting at 5 weeks until 48 weeks of age. There was no significant difference at any time point in body weights between the WT and KO mice (E) UACR of P3h2ΔPod and P3h2fl/fl mice. KO mice started to present with albuminuria at 36 weeks of age, and this had increased at 48 weeks of age. (F) Serum urea measurements for P3h2ΔPod and P3h2fl/fl mice. No significant increase was observed in the KO mice. (G) Serum cystatin C measurement for P3h2ΔPod and P3h2fl/fl mice. No significant increase was observed in the KO mice. (H) Hematuria was detected in spot urine of P3h2ΔPod mice. Representative images of urine from mice of each genotype. There were significantly more and dysmorphic RBCs in KO urine than WT urine. Scale bar: 50 μm: inset zoom, ×5. (I) Quantification of urinary RBCs under a light microscope. n ≥ 3. Graphs show the mean ± SD. *P < 0.05, **P < 0.01, ***P < 0.001, and ****P < 0.0001, by unpaired, 2-tailed Student’s t test.

