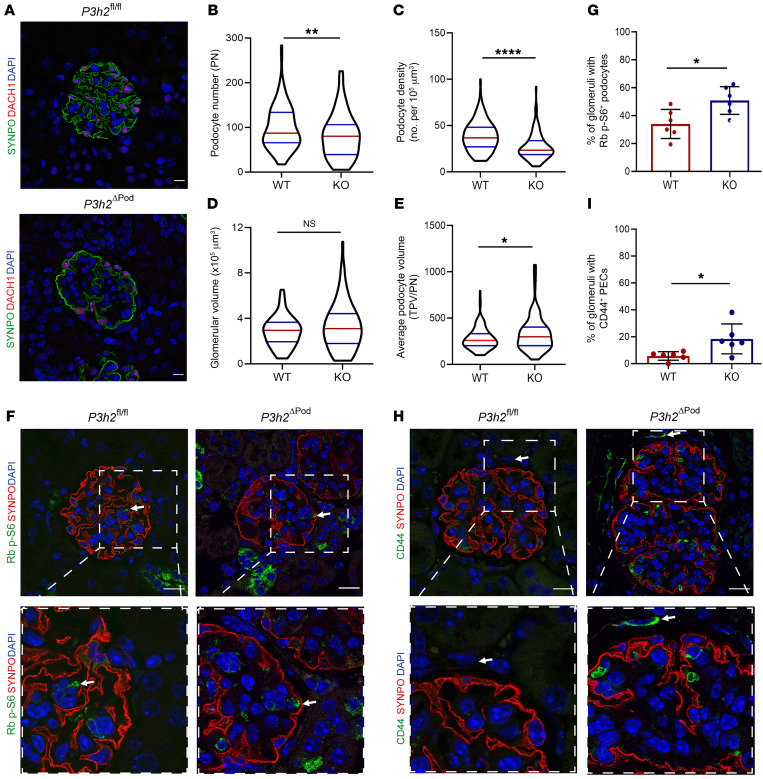
Figure 5. Podocyte morphometric analysis of P3h2ΔPod and P3h2fl/fl mice.
(A) Representative immunofluorescence images of WT and KO mouse kidney tissue stained for SYNPO, DACH1, and DAPI. The images were used for the measurement of podocyte number, podocyte density, glomerular volume, and average podocyte volume (average podocyte volume = total podocyte volume/podocyte number [TPV/PN]). Scale bar: 10 μm. (B) Podocyte numbers for WT and KO mice. The number of podocytes was significantly decreased in KO mice glomeruli, indicating podocyte loss. (C) Podocyte density for WT and KO mice. In KO mouse glomeruli, the podocyte density was significantly decreased compared with that of WT glomeruli, again indicating podocyte loss. (D) Glomerular volume for WT and KO mice. There was no significant difference in glomerular volumes between WT and KO mice. (E) Average podocyte volume for WT and KO mice. A significant increase in the average podocyte volume was observed in KO mouse glomeruli, indicating podocyte hypertrophy. (F) Podocyte hypertrophy evaluation for P3h2ΔPod and P3h2fl/fl mice using immunofluorescence staining for ribosomal (Rb) p-S6, SYNPO, and DAPI. Representative immunofluorescence images show Rb p-S6 (green) in podocytes from both WT and KO mice (white arrows). Scale bars: 20 μm; inset zoom, ×5. (G) Quantification of immunofluorescence images showed a significant increase in podocyte hypertrophy in KO glomeruli when compared with WT glomeruli. (H) PEC activation analysis of P3h2ΔPod and P3h2fl/fl mice via immunofluorescence staining for CD44, SYNPO, and DAPI. Representative immunofluorescence images for KO mice show CD44 (green) signal in PECs (white arrow), indicating PEC activation. Representative immunofluorescence images for WT mice show no CD44+ signal in PECs (white arrow). Scale bars: 20 μm. Inset zoom, ×5. (I) Quantification of immunofluorescence images indicated a significant increase in the percentage of glomeruli with activated PECs in KO mice when compared with those of WT mice. n = 6. Data show the mean ± SD. *P < 0.05, by unpaired, 2-tailed Student’s t test. Graphs in B–E show the median ± IQR (n ≥6); *P < 0.05, **P < 0.01, and ****P < 0.0001, by Mann-Whitney U test. Graphs in G and I show the mean ± SD (n = 6).

