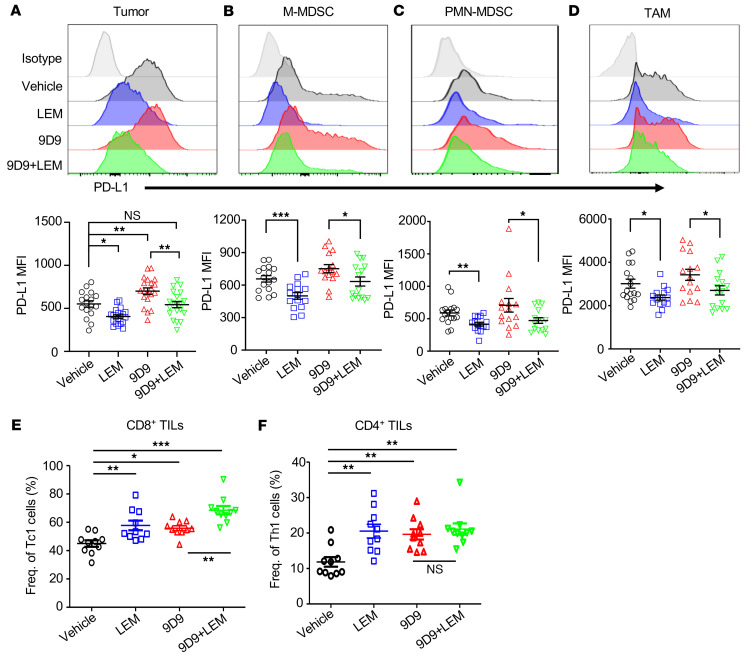
Figure 5. Echinomycin suppresses PD-L1 on tumor cells and tumor-infiltrating myeloid cells and expands the IFN-γ–producing CD8+ and CD4+ T cells with or without anti–CTLA-4 antibodies.
C57BL/6 mice received E0771 cells (0.5 × 10⁶/mouse) on day 0 followed by treatment with vehicle, echinomycin (LEM, 0.25 mg/kg/dose), anti–CTLA-4 (9D9, 0.2 mg/mouse/dose), or 9D9 plus LEM on days 6, 8, 10, and 12. On day 14, the tumors were analyzed by flow cytometry. (A–D) PD-L1 expression on tumor and tumor-associated myeloid cells. PD-L1 expression was analyzed on tumor cells (gated on live CD45– singlets) (A), M-MDSCs (gated on live CD45+CD11b+CD11c–Ly6ChiLy6G– singlets) (B), PMN-MDSCs (gated on live CD45+CD11b+CD11c–Ly6CintLy6G+ singlets) (C), or CD11c+ TAMs (gated on live CD45+CD11b+CD11c+ singlets) (D). Upper panels show representative histograms of PD-L1. In the lower panels, dot plots show the PD-L1 MFI for individual mice from 3 independent experiments (n = 5 mice/group/experiment). The data are presented as the mean ± SEM of PD-L1 MFI and were analyzed by 1-way ANOVA with Sidak’s multiple-comparison test (A) or by 2-tailed, unpaired Student’s t test (B–D). (E and F) Frequency of TILs producing IFN-γ. The frequencies of CD8+IFN-γ+ (Tc1) among total CD8+ TILs (E) and CD4+IFN-γ+ (Th1) among total CD4+ TILs (F) are shown. The tumor cell suspensions were cultured for 4 hours in the presence of PMA plus ionomycin and GolgiStop prior to staining. The dot plots show the Tc1 or Th1 cell frequencies for individual mice from 2 independent experiments (n = 5 mice/group/experiment), which were analyzed by 1-way ANOVA with Sidak’s multiple-comparison test. *P < 0.05; **P < 0.01; ***P < 0.001.

