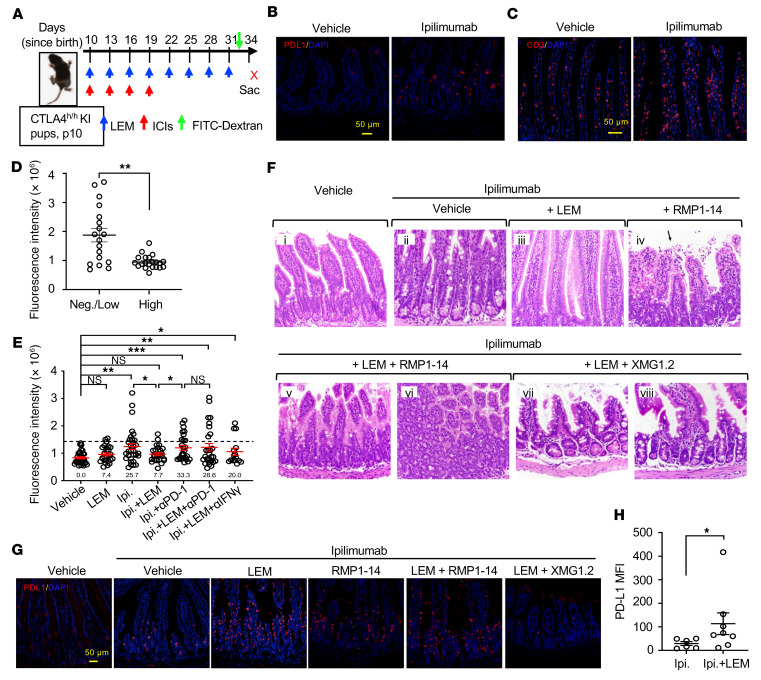
Figure 8. Echinomycin induces PD-L1 to counter ipilimumab-induced GI irAEs by an IFN-γ–dependent mechanism.
(A) Experimental design. Ipilimumab (Ipi.) was used to induce GI irAEs in CTLA4h/h pups (detailed in Methods). Single dose of ipilimumab and other agents are indicated in the diagram by arrows (red, mAbs; blue, vehicle/LEM). ICIs, immune checkpoint inhibitors (mAbs). (B and C) Representative immunofluorescence images showing T cell infiltration (B) or PD-L1 expression (C) in jejunum of vehicle- or ipilimumab-treated mice. (D) Association of intestinal PD-L1 expression with GI irAEs determined by FITC-dextran assay. Intestinal PD-L1 expression was scored as negative/low (n = 18) or high (n = 21) based on immunofluorescence, and serum FITC-dextran intensity is presented as the mean ± SEM for each group, analyzed by Student’s t test. Aggregate data shown from 4 experiments. (E–G) Effects of LEM, anti–PD-1 (RMP1-14), and anti–IFN-γ (XMG1.2) in the GI irAE model. Mice were grouped as follows to receive therapies based on the experimental design depicted in A: vehicle (n = 33), LEM (n = 27), ipilimumab (n = 33), ipilimumab plus LEM (n = 26), ipilimumab plus RMP1-14 (n = 27), ipilimumab plus LEM plus RMP1-14 (n = 28), and ipilimumab plus LEM plus XMG1.2 (n = 15). (E) Serum FITC-dextran intensity shown as mean ± SEM for individual mice pooled from 3 independent experiments. GI irAE incidence corresponding to each group is annotated (percentages); dotted line represents the threshold for the determination of GI irAEs. Statistics were determined by 2-tailed, unpaired Student’s t test. (F) Representative H&E images from intestines of mice receiving different therapies. Panel iv shows cellular debris and necrosis in lamina propria and epithelium (arrow). (G) Representative immunofluorescence images showing PD-L1 staining in jejunum of mice from different treatment groups. Scale bars: 50 μm (B, C, and G). (H) Flow cytometry analysis of PD-L1 expression in intestinal epithelial cells (gated on live CD45–cytokeratin+ singlets) from mice treated with ipilimumab (n = 6) or ipilimumab plus LEM (n = 8). Data shown as mean ± SEM of the PD-L1 MFI for each mouse, and were analyzed by 2-tailed, unpaired Student’s t test. *P < 0.05; **P < 0.01; ***P < 0.001.

