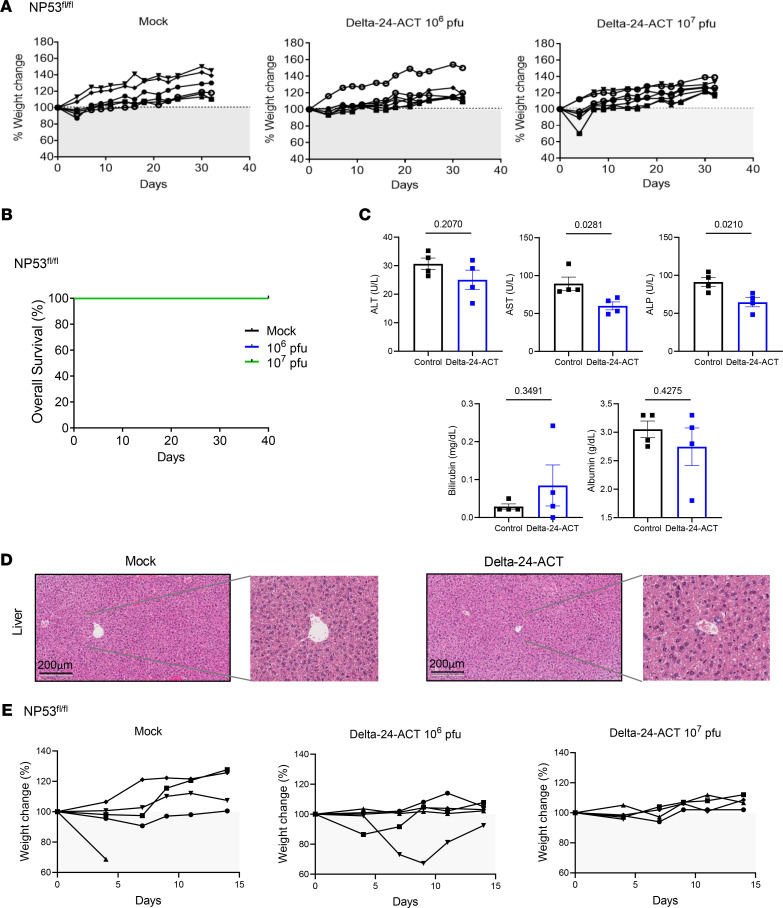
Figure 3. Assessment of Delta-24-ACT toxicity in vivo.
(A) NP53fl/fl mice were treated intraparenchymally with mock treatment (PBS) (n = 6) or Delta-24-ACT (n = 7) at the indicated doses. Mice from the different groups were weighed every 3–4 days until the end of the treatment (30 days). (B) Kaplan-Meier survival plot of NP53fl/ mice treated with PBS (control group) and 106 PFUs or 107 PFUs of Delta-24-ACT in the pons. (C) Evaluation of biochemical parameters related to hepatic toxicity after intratumoral injection of Delta-24-ACT. The mice were treated with the mock treatment or virus, and serum samples were collected 3 days later. Several parameters were measured, including alanine aminotransferase (ALT, U/L), aspartate aminotransferase (AST, U/L), and alkaline phosphatase (ALP, U/L) levels, to monitor hepatic injury and bilirubin (mg/dL) and albumin (g/dL) levels to assess hepatic function. Student’s t test was performed, and P values are shown above bars. Data are shown as the mean ± SEM. (D) Histologic analysis of mouse livers bearing orthotopic DIPGs and treated locally with Delta-24-ACT at 108 PFUs. Representative micrographs of H&E staining of mouse livers from the indicated groups of DIPG models. Scale bar: 200 μm. The images show no viral presence in mouse livers and no signs of hepatotoxicity. (E) Percentage of weight change in NP53fl/fl mice bearing NP53 tumors treated with 106 or 107 PFUs/mouse Delta-24-ACT or PBS (as a control).

