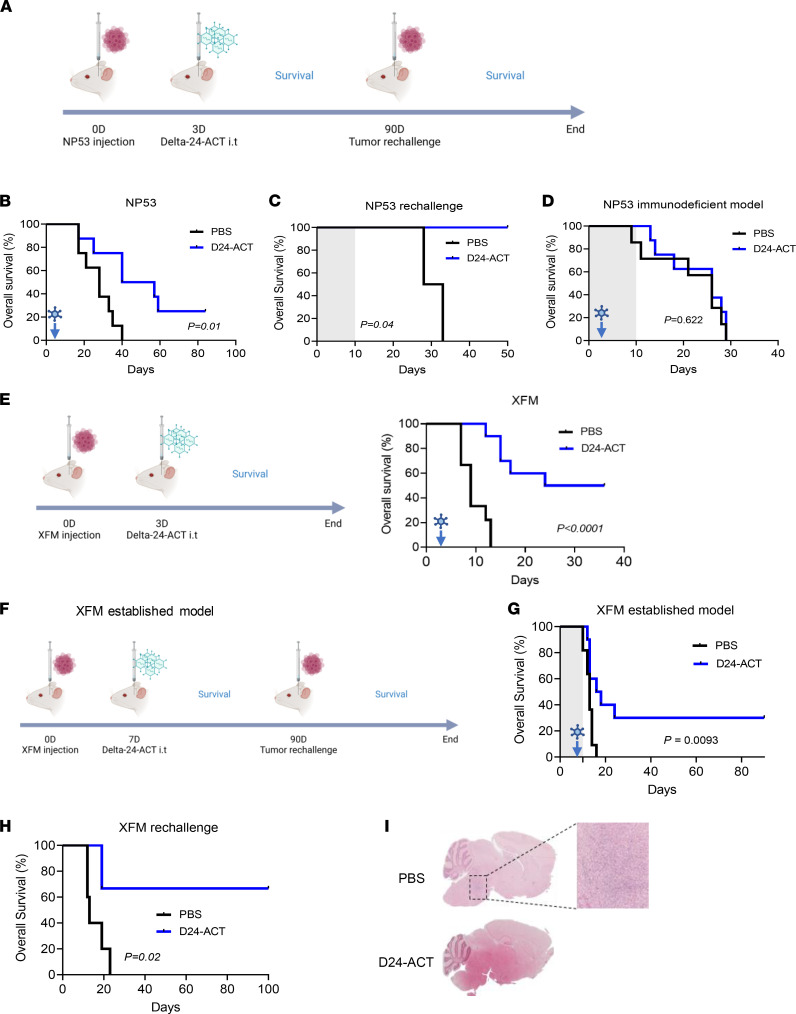
Figure 4. Characterization of the antitumor effect of Delta-24-ACT in DIPG orthotopic models.
(A) Schedule of survival experiments performed with NP53 cells. (B) Kaplan-Meier survival plot of mice bearing NP53 cells treated with 106 PFUs of Delta-24-ACT or a mock PBS control 3 days after cell administration (log-rank; P = 0.01, n = 8 each group). (C) The long-term survivors from the Delta-24-ACT–treated group (n = 2) were subjected to rechallenge with NP53 and compared with control naive mice (n = 4) (log-rank; P < 0.04). (D) Kaplan-Meier survival plot of immunodeficient mice (BALB/cA-Rag2−/−γc−/−) bearing NP53 cells treated with 106 PFUs of Delta-24-ACT (n = 8) or a mock PBS control (n = 7) 3 days after cell administration (log-rank; P = 0.600). (E) Schedule of survival experiments performed with XFM cells, and Kaplan-Meier survival plot of mice bearing XFM cells that were treated with 106 PFUs of Delta-24-ACT (n = 10) or the mock PBS control 3 days after cell administration (n = 9) (log-rank; P < 0.0001). (F) Schedule of the survival experiment with the established XFM model; Delta-24-ACT was administered 7 days after cell injection. (G) Kaplan-Meier survival plot of mice bearing XFM-established tumors treated with 106 PFUs of Delta-24-ACT (n = 10) or a mock PBS control (n = 11) 7 days after cell administration (log-rank; P = 0.0009). (H) The long-term survivors from the Delta-24-ACT–treated group (n = 3) were subjected to rechallenge with XFM and compared with control naive mice (n = 5) (log-rank; P = 0.02). (I) Representative micrographs of XFM long-term survivors free of disease versus a naive control (PBS) that presented a tumor. Original magnification, ×4; ×100 (high-magnification image).

