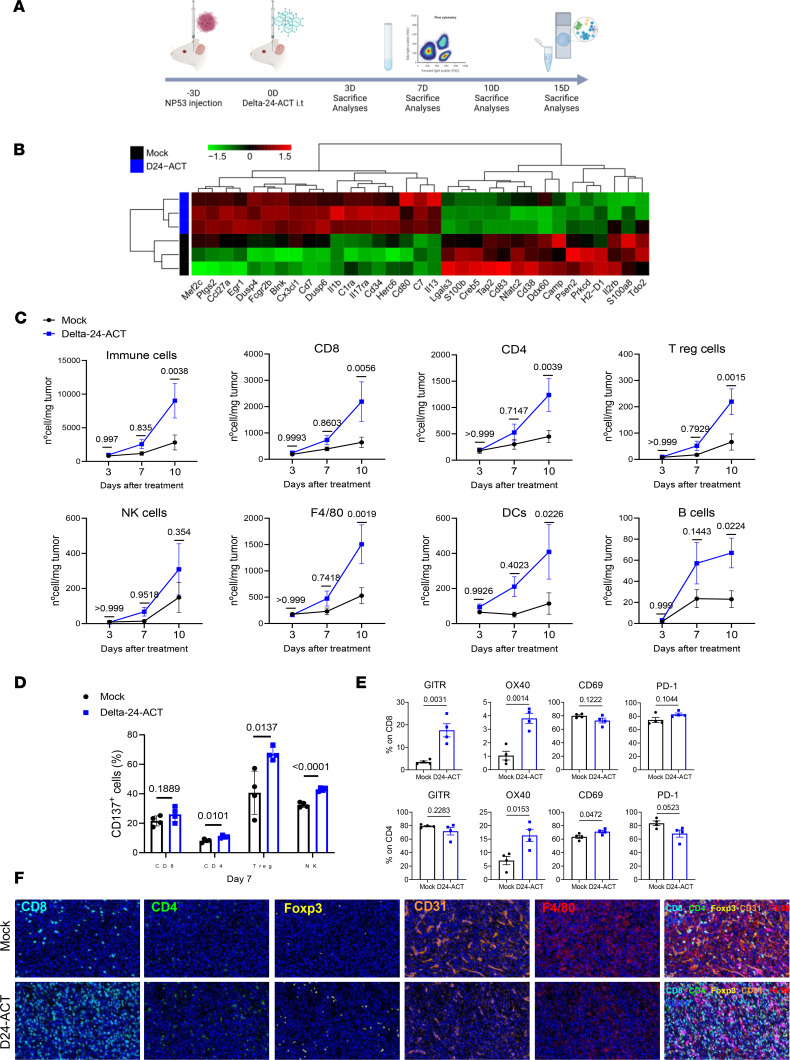
Figure 5. Modulation of the tumor microenvironment by Delta-24-ACT treatment.
(A) Schedule of mechanistic studies in the NP53 model. NP53 cells were engrafted (day –3), and animals were treated with a mock control or Delta-24-ACT (106 PFUs) 3 days later. Animals were sacrificed 3 (3D), 7 (7D) or 10 (10D) days later for flow cytometry and 15 (15D) days later for NanoString and IHC multiplex analyses. (B) Representative heatmap of transcriptome profiling using gene set enrichment analysis of murine DIPG tumors from mock-treated and Delta-24-ACT–treated mice (n = 3) using the 770-gene pancancer immunoprofile panel in NanoString. (C) Flow cytometry analyses of different immune cell populations in the brains of mice bearing NP53 tumors on the indicated days after treatment with Delta-24-ACT (blue) or PBS (black). Data are shown as number of cells/mg tumor. Two-way ANOVA was performed, and P values are shown above respective bars. (D) CD137 expression (percentage) in T cell populations and NK cells 7 days after viral treatment. Multiple comparisons t test was performed (n = 4 each group), and P values are shown above respective bars. Data are shown as the mean ± SEM. (E) Flow cytometry analyses of different activation (GITR, OX40, CD69) and exhaustion (PD-1) markers were performed in the CD8+ and CD4+ cell subsets at 7 days after viral administration. Data are shown as the mean ± SEM (n = 4 each group), and P values are shown above respective bars. (F) The brains of mice bearing NP53 cells were subjected to multiplexed immunofluorescence analysis to detect the following immune cell markers: CD8 (light blue), CD4 (green), Foxp3 (yellow), CD31 (orange), F4/80 (red), and GFAP (pink). The nuclei were counterstained with DAPI (blue). Representative micrograph are shown (n = 3) Original magnification, ×20.

