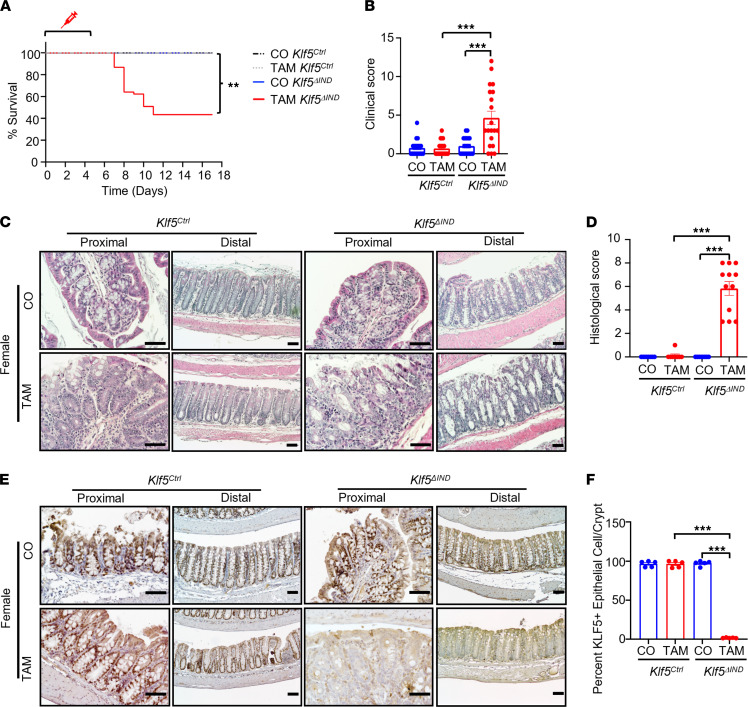
Figure 2. Deletion of Klf5 from intestinal epithelial cells increases mortality and alters colonic morphology.
(A) Kaplan-Meier survival curve of CO and TAM treatment for Klf5Ctrl and Klf5ΔIND mouse genotypes (n = 15). (B) Quantification of clinical scores of CO- and TAM-treated Klf5Ctrl and Klf5ΔIND mice. Max for the clinical score is 12 and quantified with 3 categories: stool consistency, weight loss, and fecal blood (n = 20). (C) H&E staining of whole colon tissue from female Klf5Ctrl and Klf5ΔIND mice treated with CO or TAM (n = 12). (D) Quantification of histological scores of CO- and TAM-treated Klf5Ctrl and Klf5ΔIND mice. Max for the histological score is 11 and quantified with 3 categories: crypt damage, inflammatory cells in lamina propria, and ulcers (n = 20). (E) IHC staining of KLF5 in whole colon tissue from female Klf5Ctrl and Klf5ΔIND mice treated with CO or TAM (n = 5). (F) Quantification for percentage of KLF5+ cells per crypt (n = 5). Data from graphs represent mean ± SEM, **P < 0.01; ***P < 0.001; 1-way ANOVA. Scale bars: 70 μm.

