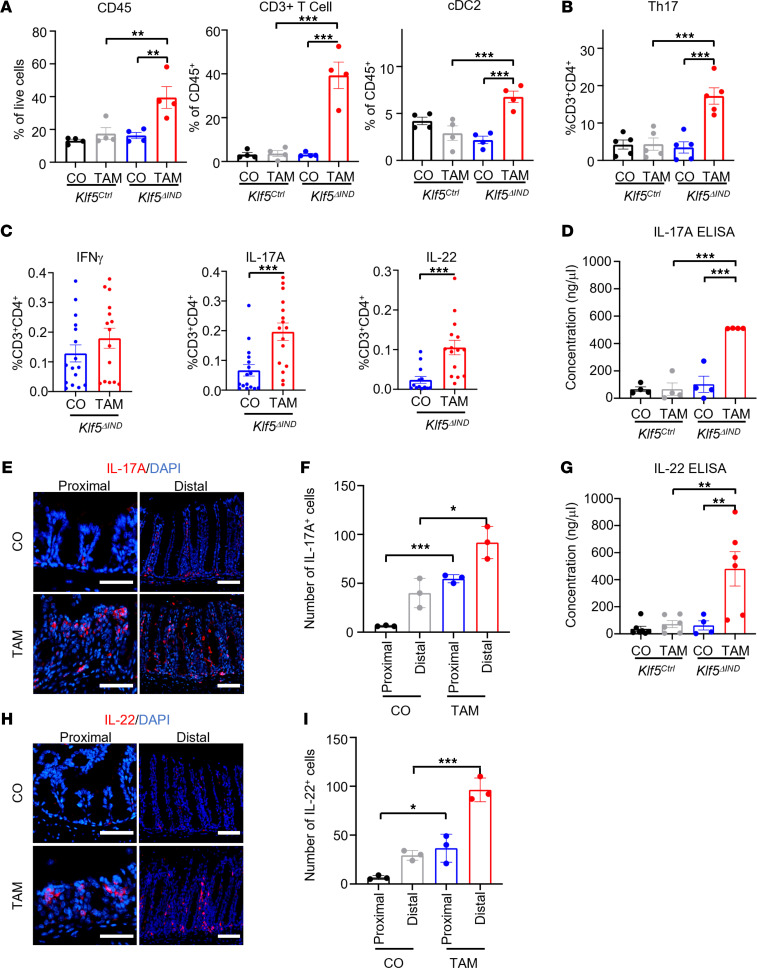
Figure 4. Intestine-specific deletion of Klf5 results in increased Th17 cells and concentrations of IL-17 and IL-22.
(A) Graph representation of gated populations. Graph on the left represents the percentage of CD45+ populations from the total number of live cells (n = 4). Middle graph represents the percentage of CD3+ cells out of the total CD45+ cells (n = 4). The right graph represents percentage of CD11c+ and CD103+ double-positive populations for conventional DC type 2 (cDC2) (n = 4). (B) Percentage of total CD4+ T cells that express the hallmark transcription factor for Th17, RORγT (n = 5). (C) Quantification of leukocytes treated with brefeldin A and ionomycin for cytokine stimulation. Percentages of cells with IFN-γ, IL-17A, and IL-22 were calculated from the total CD4+ T cell population (n = 16). (D) Quantification of IL-17A by ELISA from total tissue lysate (n = 4). (E) Immunofluorescence (IF) staining of IL-17A in whole colon tissue from CO- and TAM-treated Klf5ΔIND mice. (F) Quantification of cell numbers in proximal and distal colonic regions from the IF images (n = 3). (G) Quantification of IL-22 ELISA from total tissue lysate (n = 4). (H) IF staining of IL-22 in whole colon tissue from CO- and TAM-treated Klf5ΔIND mice. (I) Quantification of cell numbers in proximal and distal colonic regions from the IF images (n = 3). Data from graphs represent mean ± SEM, *P < 0.05; **P < 0.01; ***P < 0.001; 1-way ANOVA. Scale bars: 70 μm.

