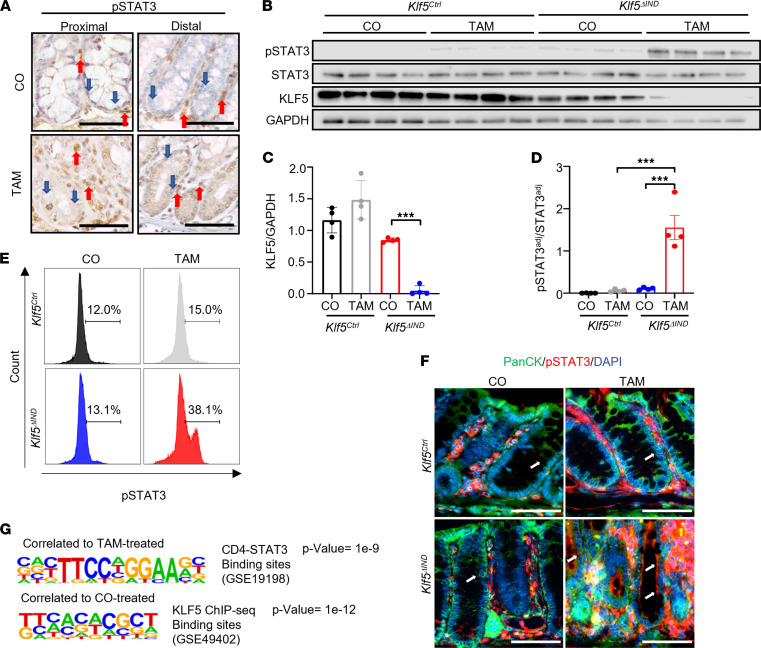
Figure 6. Deletion of Klf5 results in increased p-STAT3 in intestinal epithelial cells but aberrant cellular localization.
(A) IHC of p-STAT3 in CO- and TAM-treated Klf5ΔIND mice. Red arrows mark stromal regions of tissue. Blue arrows mark the intestinal epithelial layer (n = 5). (B) Western blot analysis of p-STAT3, STAT3, KLF5, and GAPDH from isolated epithelial cells (n = 4). (C) Quantification of KLF5 normalized with GAPDH. (D) Quantification of the adjusted p-STAT3 protein level over the adjusted STAT3 protein level. Adjustments were normalized with GAPDH for both markers (n = 4). (E) Histogram representation from FACS analysis of EpCAM+ cells that are gated p-STAT3+ (n = 6). (F) Immunofluorescence staining of colonic tissues with pan-cytokeratin and p-STAT3 antibodies. White arrows mark the intestinal epithelial layer (n = 4). (G) HOMER analysis of bulk RNA-Seq data (n = 4). The top motif represents the CD4-STAT3 binding sites, and the bottom motif presents the KLF5-binding sites. Data from graphs represent mean ± SEM. ***P < 0.001; 1-way ANOVA. Scale bars: 70 μm.

