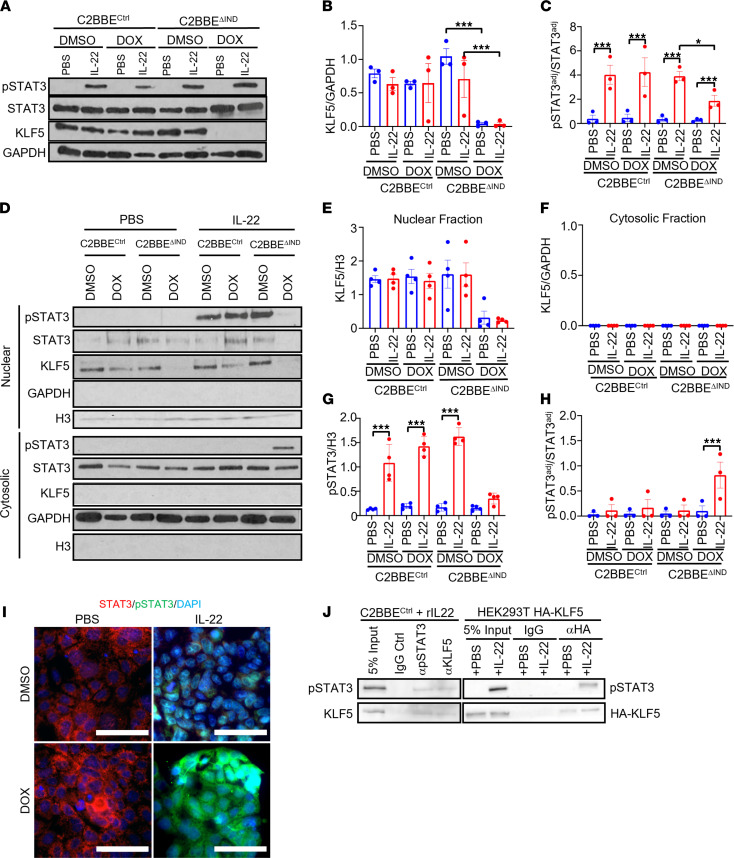
Figure 7. Knockdown of KLF5 does not induce phosphorylation of STAT3 but affects the localization of p-STAT3 in response to IL-22 stimulation.
(A) Western blots of C2BBECtrl and C2BBEΔIND cells treated with a combination of DMSO or DOX and PBS or IL-22 (n = 3). (B) Quantification of KLF5 normalized with GAPDH (n = 3). (C) Quantifications of adjusted p-STAT3 protein level over the adjusted STAT3 protein level. Adjustments were normalized with GAPDH for both markers (n = 3). (D) Western blots of cytoplasmic-nuclear fractionation assays. The top blot represents the nuclear fractions and the bottom represents the cytosolic fractions. (E and F) Quantifications for KLF5 normalized to H3 in the nuclear fraction (E) and for KLF5 normalized to GAPDH in the cytosolic fraction (F) (n = 3). (G) Quantification of p-STAT3 protein normalized to H3 in the nuclear fraction (n = 3). (H) Quantification of p-STAT3 level adjusted to GAPDH to adjusted total STAT3 levels in the cytosolic fraction (n = 3). (I) STAT3, p-STAT3, and DAPI immunofluorescence staining of C2BBEΔIND cells treated with DMSO/DOX and PBS/IL-22. (J) Co-IP of p-STAT3 and endogenous (left panel) or overexpressed KLF5 (right panel). Data from graphs represent mean ± SEM. *P < 0.05; ***P < 0.001; 1-way ANOVA. Scale bars: 70 μm.

