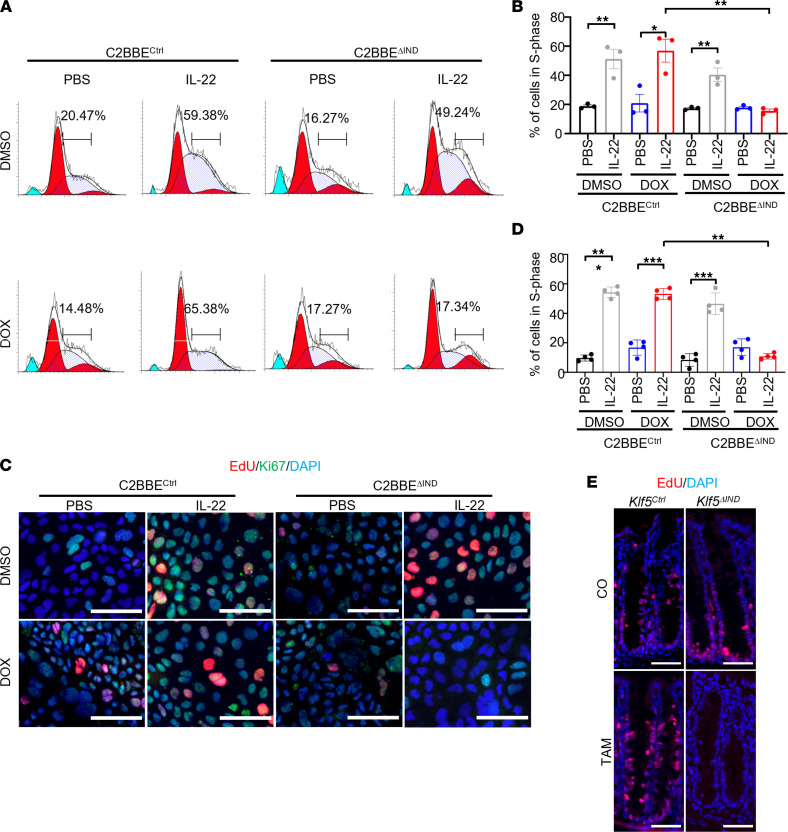
Figure 8. Knockdown of KLF5 results in decreased proliferation in vitro and in vivo.
(A) Cell cycling analysis histogram charts for ModFit. Quantifications on the chart represent the percentage of cells in the S-phase (n = 3). (B) Quantification of percentage cells in S-phase after ModFit curve fitting (n = 3). (C) Immunofluorescence (IF) staining of EdU and Ki67 in C2BBECtrl and C2BBEΔIND cells treated with DMSO/DOX and PBS/IL-22. (D) Quantification of percentage of cells in S-phase from IF images (n = 3). (E) IF staining of EdU in CO- or TAM-treated Klf5Ctrl or Klf5ΔIND mice. Data from graphs represent mean ± SEM. *P < 0.05; **P < 0.01; ***P < 0.001; 1-way ANOVA. Scale bars: 70 μm.

