. 2020 Nov 11;10(67):41047–41057. doi: 10.1039/d0ra06577c

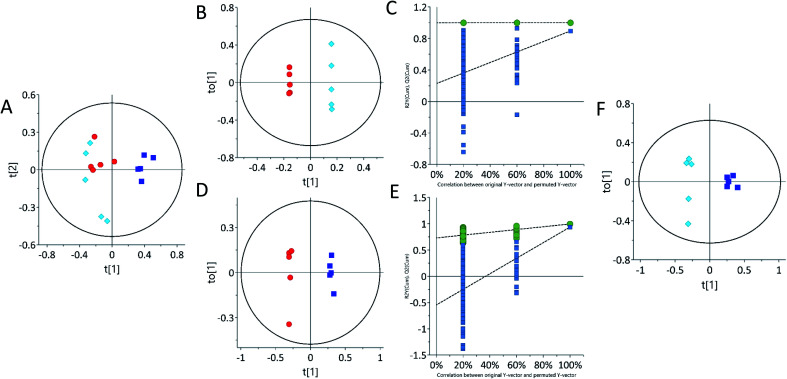
Fig. 2. Principal component analysis (PCA) and orthogonal partial least-squares discriminant analysis (OPLS-DA) of urine samples acquired by 1H NMR spectra showing separation of control and treated. (A) PCA scores plot of urine, (B, D and F) OPLS-DA scores plot of urine. (C and E) Permutation test plots (200 permutations) for control vs. 62.5 mg kg−1 (R2 0.99, 0.0; Q2 0.0, 0.87) and control vs. 125 mg kg−1 (R2 0.0, 0.99; Q2 0.0, 0.91). Each point on the scores plot represents one sample. Control samples are represented by red circles (n = 5), 62.5 mg kg−1 samples (n = 5) are represented by light blue diamonds (n = 5) and 125 mg kg−1 are represented by dark blue squares (n = 5). See Table S1 ESI for R2X (cum), R2Y and Q2 (cum) details.

Fig. 2