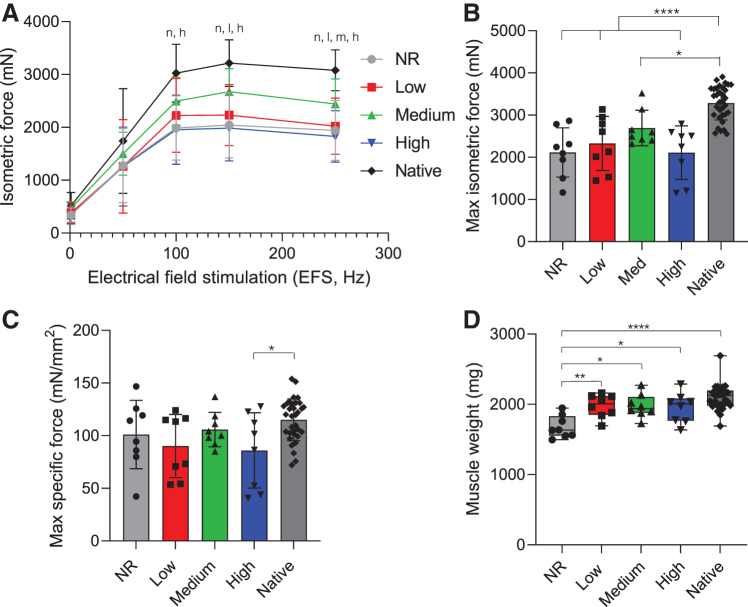
FIG. 3.
Medium stiffness hydrogels support muscle force generation most similar to native tissue. (A) Dose/response curve and (B) maximum isometric contraction force in response to electrical field stimulation at 12 weeks postsurgery. Statistically significant differences from native (p < 0.05) are denoted by n (NR), l (low), m (medium), and h (high). (C) Specific force (specific P0), calculated by normalizing maximal isometric force (P0) to PCSA, was similar to contralateral control values across all treatment groups, except muscles treated with the high stiffness (10 kPa) hydrogels. (D) Muscle weight at the time of explant shows NR muscles were significantly lighter than other experimental groups. Data presented as mean ± SD (A–C), while panel D data are presented as box plots of interquartile range (line: median) with whiskers showing minimum and maximum values. *p < 0.05, **p < 0.01, ****p < 0.0001. n = 8 muscles per experimental group and n = 32 for the native contralateral control. NR, no repair; PCSA, physiological cross-sectional area. Color images are available online.

