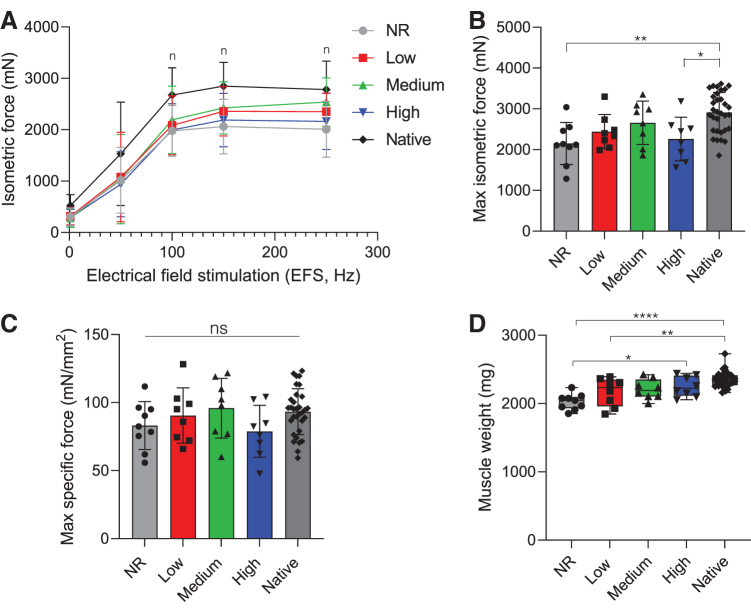
FIG. 4.
Lower stiffness hydrogels enable similar force generation to native muscle at 24 weeks. (A) Dose/response curve and (B) maximum isometric contraction force in response to electrical field stimulation at 24 weeks postsurgery. Statistically significant differences from native (p < 0.05) are denoted by n (NR). (C) Specific P0 was similar to contralateral control values across all treatment groups at the time of explant. (D) Explanted muscle weight shows NR and low stiffness hydrogel-treated muscles were significantly lighter than native muscle. Data presented as mean ± SD (A–C), while panel D data are presented as box plots of interquartile range (line: median) with whiskers showing minimum and maximum values. *p < 0.05, **p < 0.01, ***p < 0.001, ****p < 0.0001. n = 8 muscles per experimental group and n = 33 for the native contralateral control. Color images are available online.

