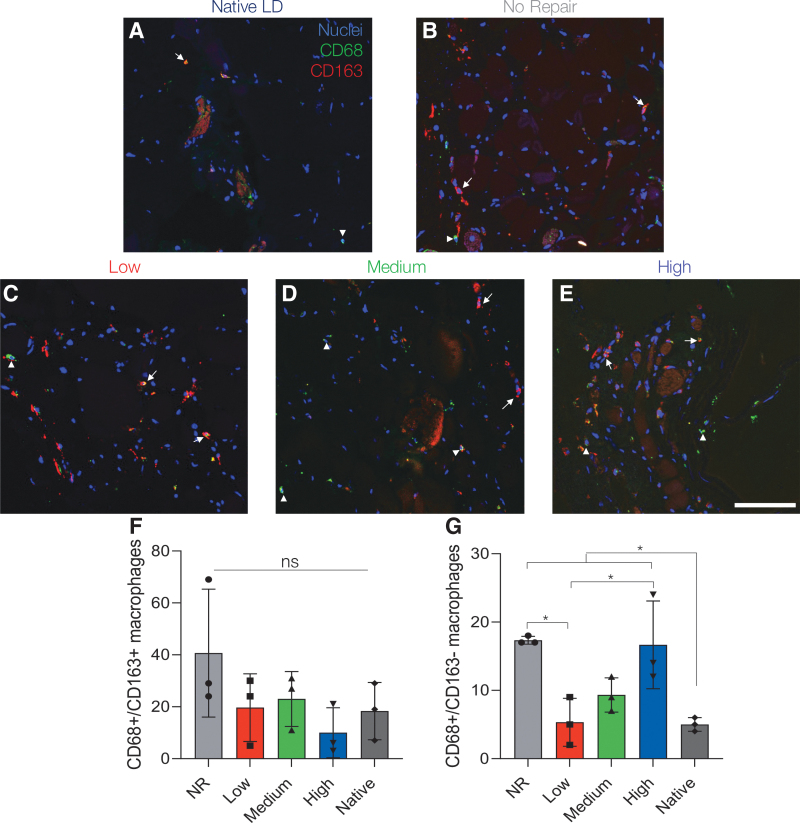
FIG. 8.
Lower stiffness hydrogels support similar macrophage polarization profiles to native muscle. (A–E) Representative images of macrophage infiltration at 24 weeks post-VML. Images were taken in the zone of regeneration showing CD68 (green, arrowhead) and CD163 (red, arrow) at the defect-tissue interface. (F) Quantification of CD68+/CD163+ cells indicative of M2 macrophages showed no statistically significant difference across experimental groups. (G) CD68+/CD163- M1 macrophages remained significantly elevated in NR and high stiffness hydrogel-treated muscle indicating a prolonged inflammatory response. Data presented as mean ± SD. *p < 0.05. n = 3 muscles per experimental group. Scale bar: 100 μm. Color images are available online.

