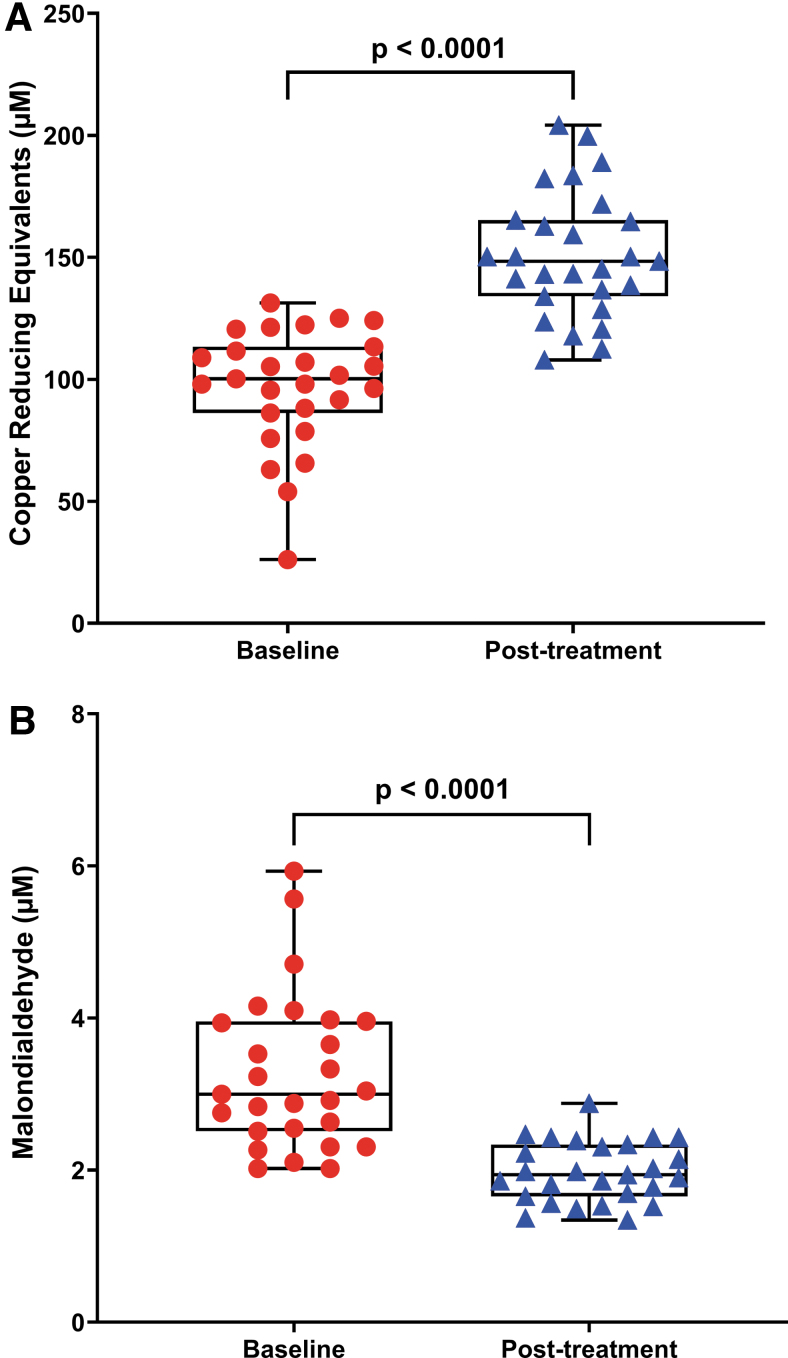
FIG. 2.
Reduction of oxidative stress status after CoQ10 and selenium supplementation among participants. Representative box plot diagram showing statistically significant differences of TAC (expressed as μM of copper-reducing equivalents) and lipid peroxidation levels (assessed by TBARS assay) (A, B) after 8 weeks' intervention from baseline. Each dot represents a single participant (n = 27). Data are expressed as mean ± SEM of duplicates and are representative of two independent experiments. The box extends from the 25th to 75th percentiles, the line represents the mean, and the whiskers show the minimum and maximum. p-Values versus baseline were calculated using the Wilcoxon signed-rank test. SEM, standard error of the mean; TAC, total antioxidant capacity; TBARS, thiobarbituric acid-reacting substances. Color images are available online.

