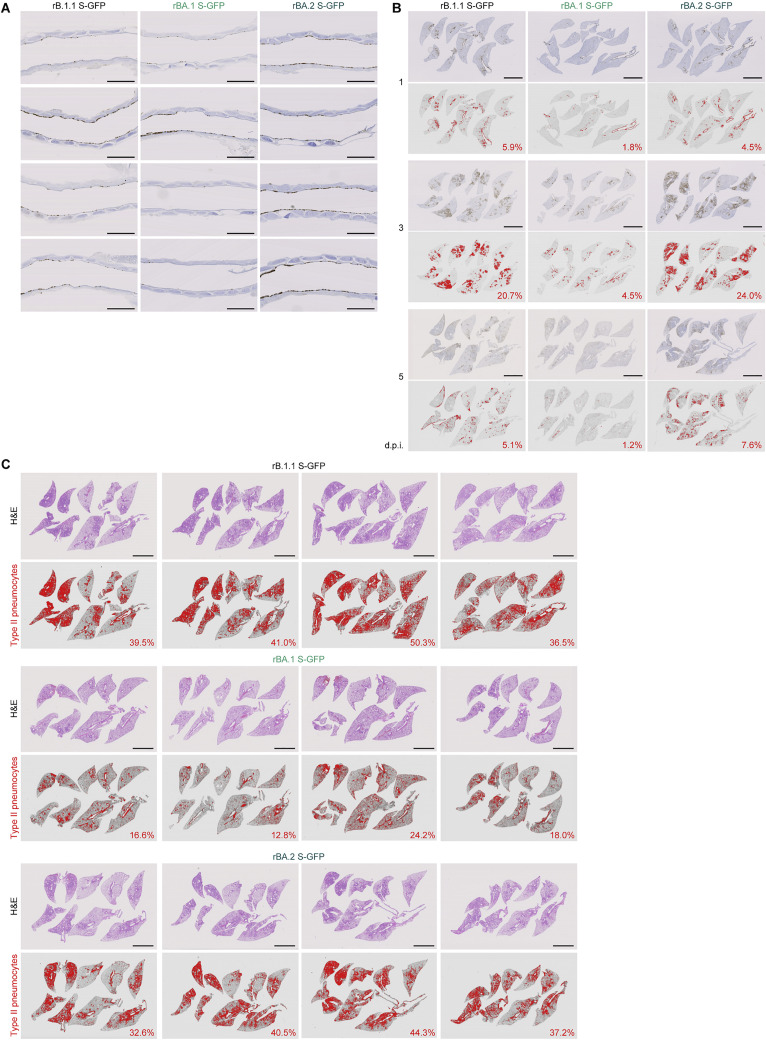
Figure S4.
Virological features of BA.2 in vivo, related to Figure 4
(A) IHC of the viral N protein in the middle portion of the tracheas of all infected hamsters (n = 4 per viral strain) at 1 d.p.i. Each panel shows a representative result from an individual infected hamster.
(B) Right lung lobes of hamsters infected with B.1.1, BA.1 or BA.2 (n = 4 for each virus) at 1, 3 and 5 d.p.i. were immunohistochemically stained with an anti-SARS-CoV-2 N monoclonal antibody. In each panel, IHC staining (top) and the digitalized N-positive area (bottom, indicated in red) are shown. The number in the bottom panel indicates the percentage of the N-positive area. Summarized data are shown in Figure 4D.
(C) Type II pneumocytes in the lungs of infected hamsters. Right lung lobes of hamsters infected with B.1.1 (n = 4), BA.1 (n = 4), and BA.2 (n = 4) at 5 d.p.i. In each panel, H&E staining (top) and the digitalized inflammation area (bottom, indicated in red) are shown. The number in the bottom panel indicates the percentage of the section represented by the indicated area (i.e., the area indicated in red within the total area of the lung lobe). The panels shown in the left column are identical to those shown in Figure 4H.
Scale bars, 1 mm (A); or 5 mm (B); or 5 mm (C).

