Figure 1.
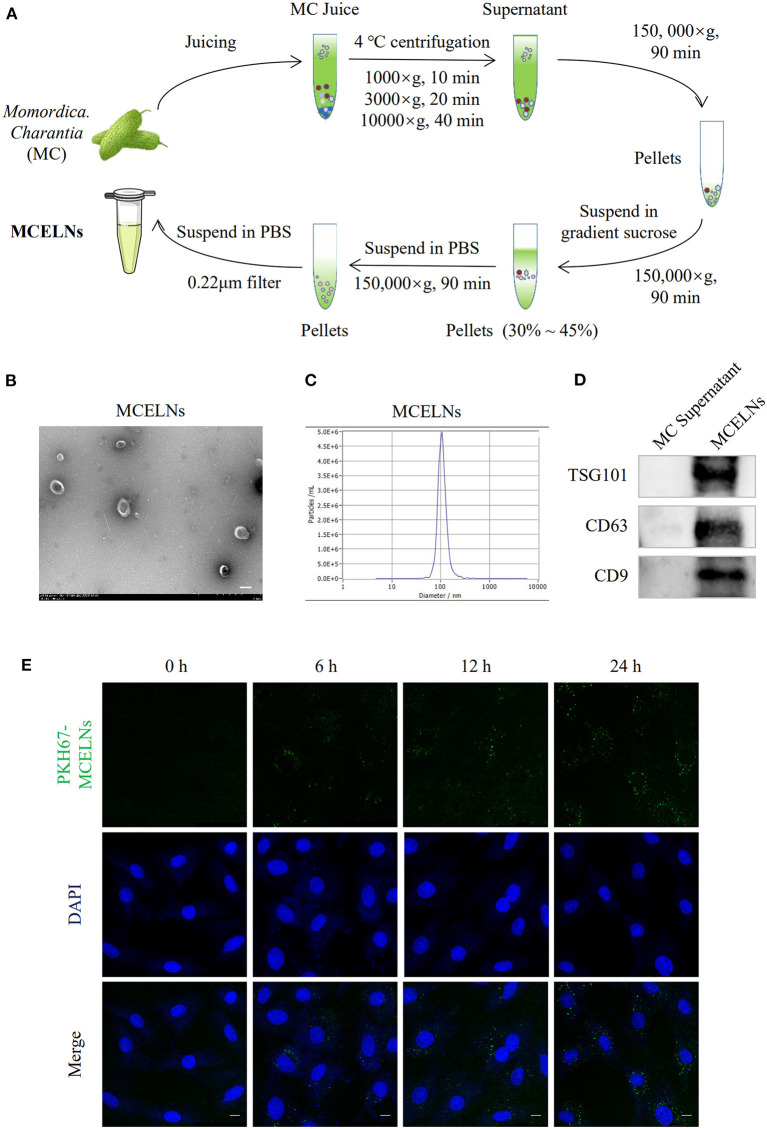
Isolation and characterization of MCELNs. (A) Flow sheet on the isolation of MCELNs from Momordica. charantia (MC) using gradient density centrifugation. (B) Transmission electron microscope image of MCELNs, scale bar: 2 μm. (C) NTA analysis exhibited the diameter of MCELNs was around 106.0 nm. (D) Western blot analysis of EVs biomarker, including TSG101, CD63, and CD9 in MC supernatant and MCELNs. (E) Representative images on the uptake of PKH67-labled MCELNs (green) in H9C2 cells when co-cultured at 0, 6, 12, 24 h. The nucleus were stained with DAPI (blue), scale bar: 10 μm.

