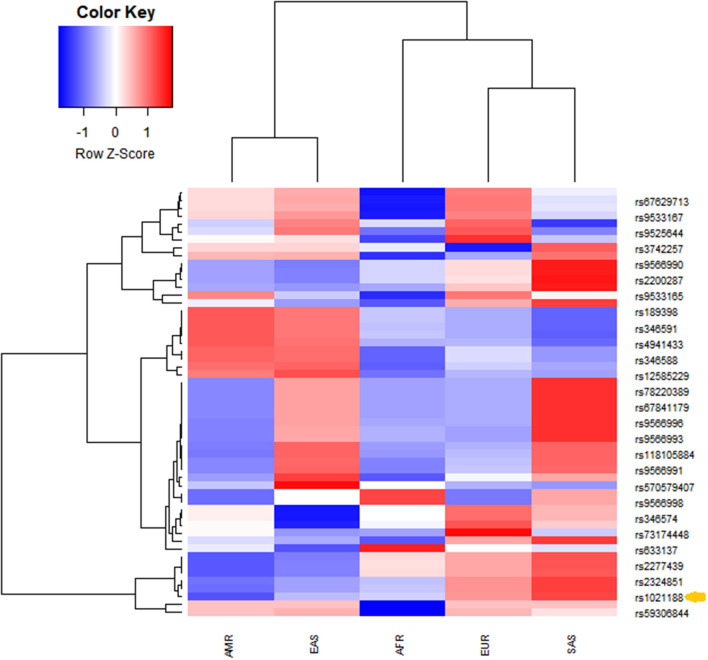
Figure 2.
Unsupervised hierarchical clustering and heatmaps of (rows) the identified TNFSF11 SNPs in linkage disequilibrium with the rs1021188 SNP across (columns) different populations (from the combined 1,000 Genomes project Phase3 database). Cells are color-coded according to the log10 of p-value, which evaluates the higher (enrichment)/lower (depletion) effect allele in a population, compared with the average of wholly one. The red color signifies a high level of allele frequency, and the blue signifies a low level of allele frequency. AFR, African (1,000 Genomes); AMR, American (1,000 Genomes); EAS, East Asian (1,000 Genomes); EUR, Europe (1,000 Genomes); SAS, South Asian (1,000 Genomes). The arrow indicates the rs1021188 SNP associated with OTSC.

