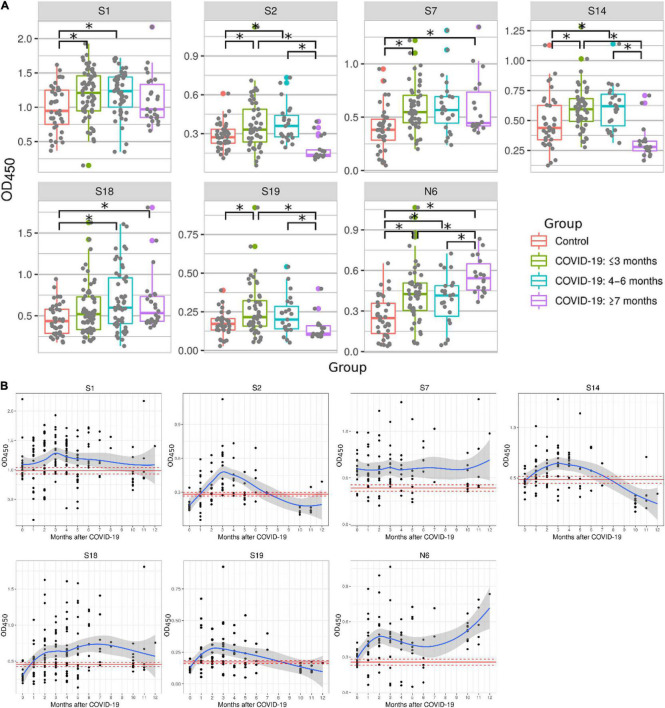
FIGURE 3.
Reactivity of COVID-19 serum samples with SARS-CoV-2 peptides depending on time after convalescence. Antibody reactivity was analyzed using ELISA. Peptides were adsorbed on a 384-well plate and probed with serum samples. (A) Reactivity to SARS-CoV-2 peptides in COVID-19 serum samples grouped as: ≤3 months, 4–6 months and ≥7 months. Asterisks indicate statistically significant differences between reactivity to SARS-CoV-2 peptides depending on time since infection (p < 0.05, Kruskal-Wallis test with Benjamini-Hochberg adjustment). (B) Detailed dynamics of COVID-19 antibody reactivity with SARS-CoV-2 peptides. Red line- mean OD450 value in control; Dotted red line – mean ± standard error of mean of OD450 values in control; Blue line – local regression line (LOESS) of OD450 value in COVID-19; Gray area – standard error of mean for LOESS of OD450 values in COVID-19.

