Figure 1.

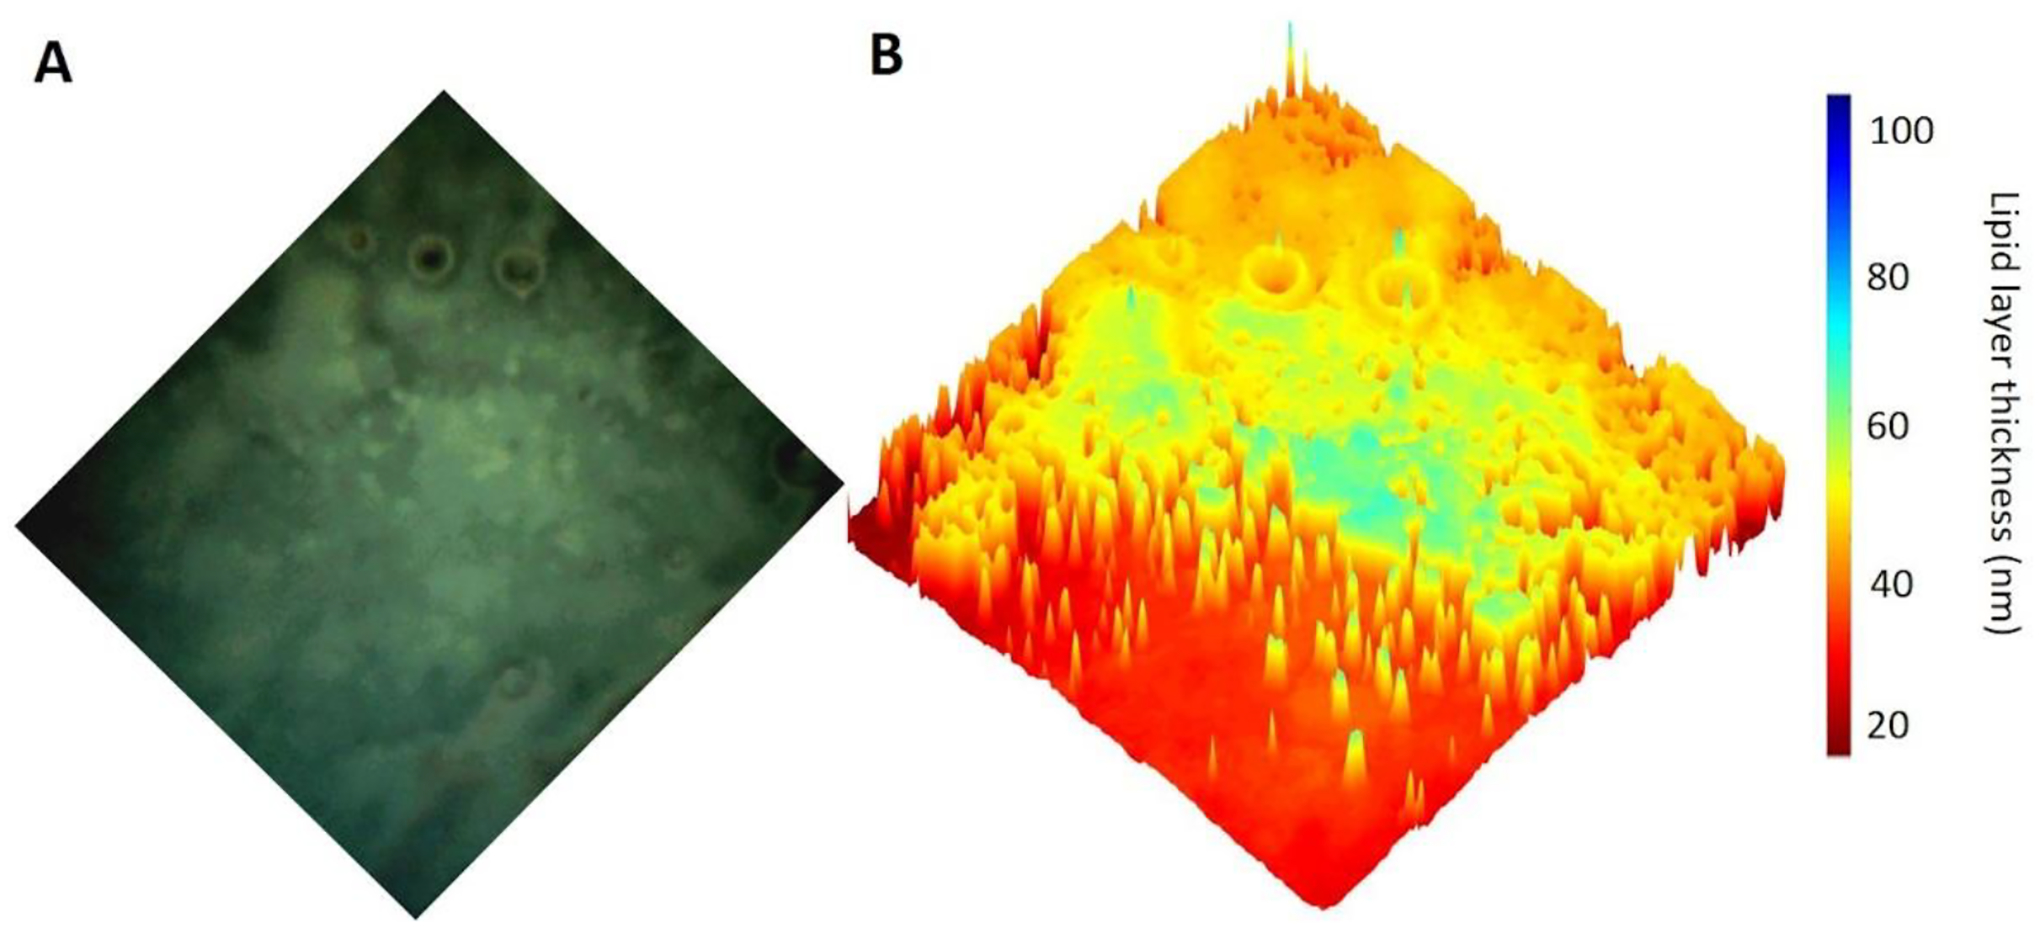
Quantitative processing of a LLM TFLL image showing physical thickness distribution. (A) Representative image of the TFLL. (B) Visualization of the spatial distribution of TFLL thickness using a 3D surface plot.

Quantitative processing of a LLM TFLL image showing physical thickness distribution. (A) Representative image of the TFLL. (B) Visualization of the spatial distribution of TFLL thickness using a 3D surface plot.