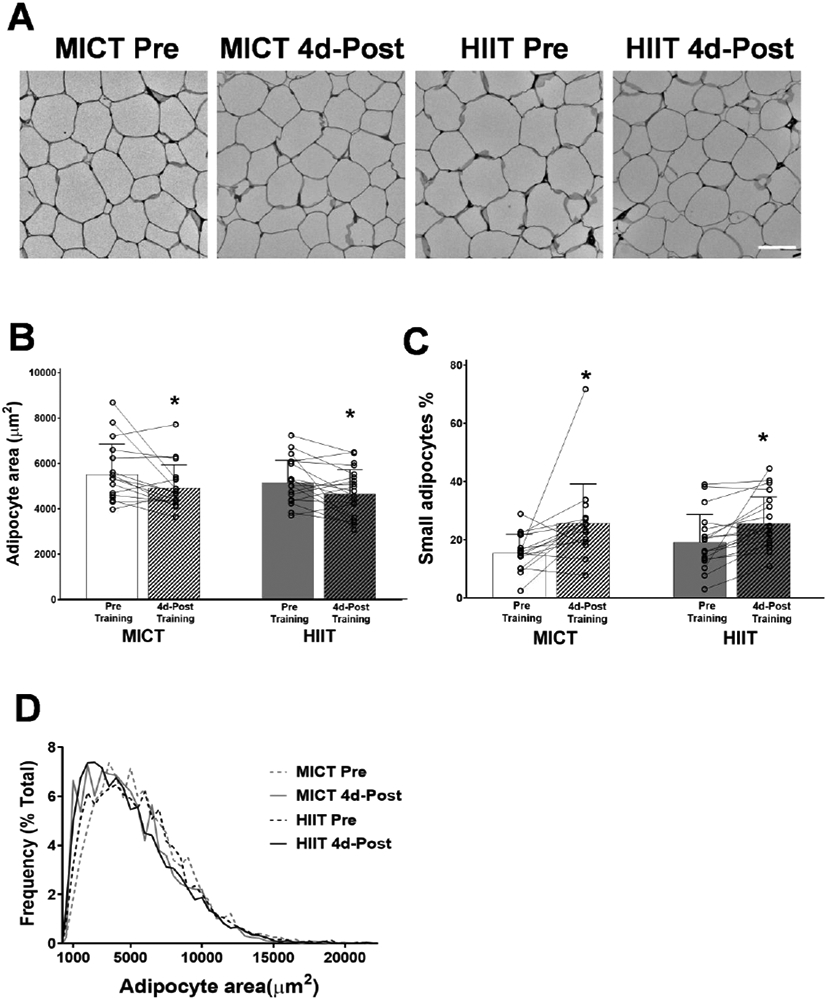
Figure 2. Changes in adipocyte cell size in response to training.

A) Representative images of H&E stained aSAT. White scale bar refers to 100μm. B) Mean adipocyte area. C) Proportion of smaller adipocytes (1000μm2 ≤ area ≤ 3000μm2). C) Frequency distribution of adipocyte area. Sample sizes were MICT n = 16 and HIIT = 18. *Significant main effect of training status (p < 0.05). ** Significant main effect of training status (p < 0.01). There were no significant effects of training group or training group x training status interactions.
