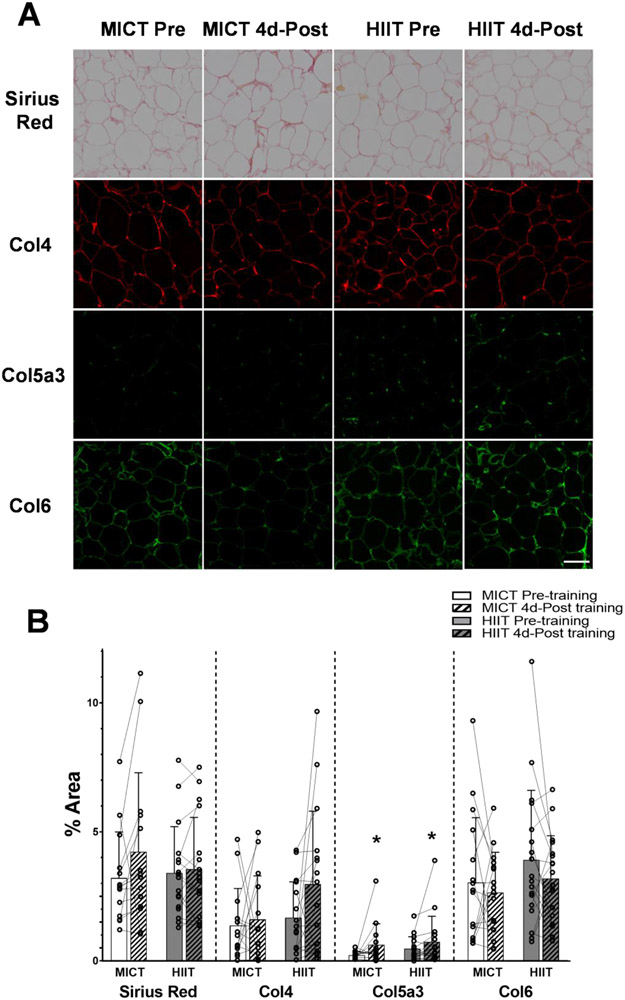
Figure 3. Adaptation of aSAT fibrosis and ECM proteins in response to training.
A) Representative staining images of Sirius Red, Col4, Col5a3, and Col6 in aSAT section. White scale bar refers to 100μm. B) Abundance of ECM proteins quantified from histology images. Sample sizes were MICT n = 14 and HIIT n = 17 for Sirius Red, MICT n = 14 and HIIT n = 16 for Col4 and Col5a3, and MICT n = 16 and HIIT n = 18 for Col6. *Significant main effect of training status (p<0.05). There were no significant effects of training group or training group x training status interactions.

