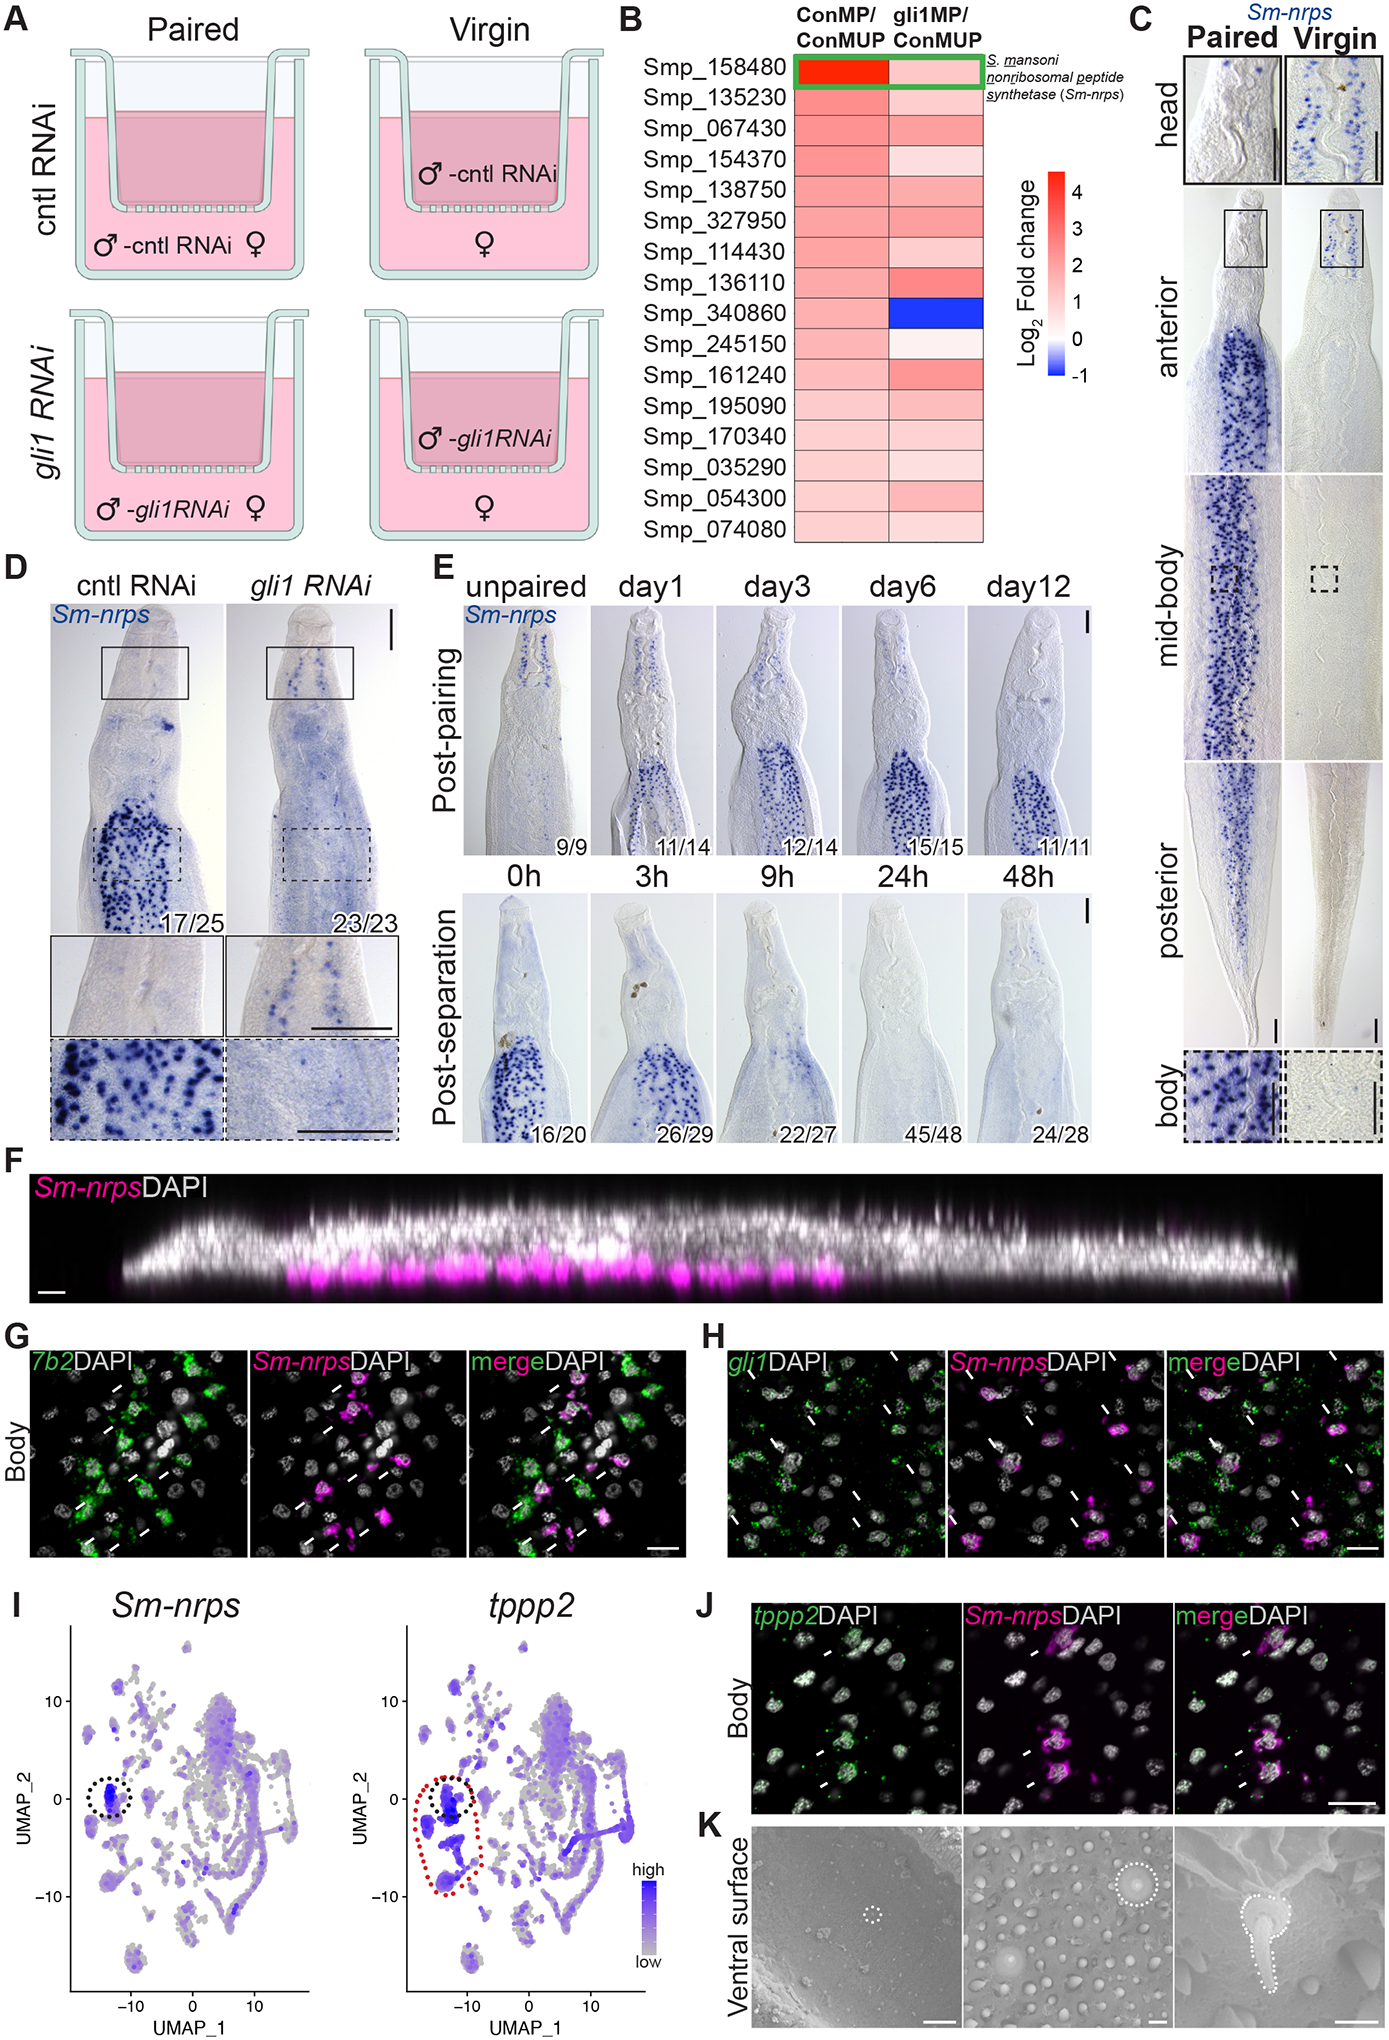
Figure 2. RNA-seq revealed Sm-nrps as a gli1-dependent and pairing-dependent gene in male parasites.

(A) Scheme to identify gli1-dependent changes in gene expression following pairing. Immature females were either paired with or separated from control (cntl) or gli1 RNAi males using a cell strainer. At three days of co-cultivation, worms were prepared for RNAseq. (B) Heatmap showing gli1-dependent transcriptional changes in paired male worms. ConMP, paired cntl male; ConMUP, unpaired cntl male; gli1MP, paired gli1 RNAi male. Green rectangle highlights the S. mansoni nonribosomal peptide synthetase (Sm-nrps) gene (Smp_158480). Genes limited to those with 2-fold change and adjusted p value < 0.0001 in the comparison of ConMP to ConMUP. (C and D) WISH showing the expression of (C) Sm-nrps mRNA in male parasites from mixed or single sex infections and (D) Sm-nrps following RNAi of gli1 in paired male parasites. n > 10 parasites across 3 experiments. Insets show expression in head or body from regions enclosed in solid or dashed rectangles, respectively. (E) WISH showing the expression of Sm-nrps at various time points post-pairing (top) or following separation from female worms (bottom). n = 3 experiments with n > 9 worms. For panels D and E, numbers indicate fraction of worms that similar to those presented/total number examined. (F) Sagittal confocal section of Sm-nrps FISH (magenta). (G and H) FISH showing expression of Sm-nrps with (G) 7b2 or (H) gli1 in the body of paired male worms. (I) Single-cell sequencing UMAP plots from adult worms showing the expression of Sm-nrps (left) and tppp2 (right). The black dotted circle highlights Sm-nrps+ cells, whereas the red dotted circle highlights tppp2+ ciliated neurons. (J) FISH for tppp2 and Sm-nrps in the body of paired male worms. In G, H and J, arrows indicate co-expression. (K) Scanning electron micrographs showing the ventral surface of a male. White dotted lines indicate sensory cilium-like structure. Representative images from 3 parasites. In panels F-H, J nuclei are gray. Scale bars, C, D, E, 100 μm; F, G, H, J, 10 μm; K, left, 20 μm, middle, 1 μm, right, 0.5 μm.
