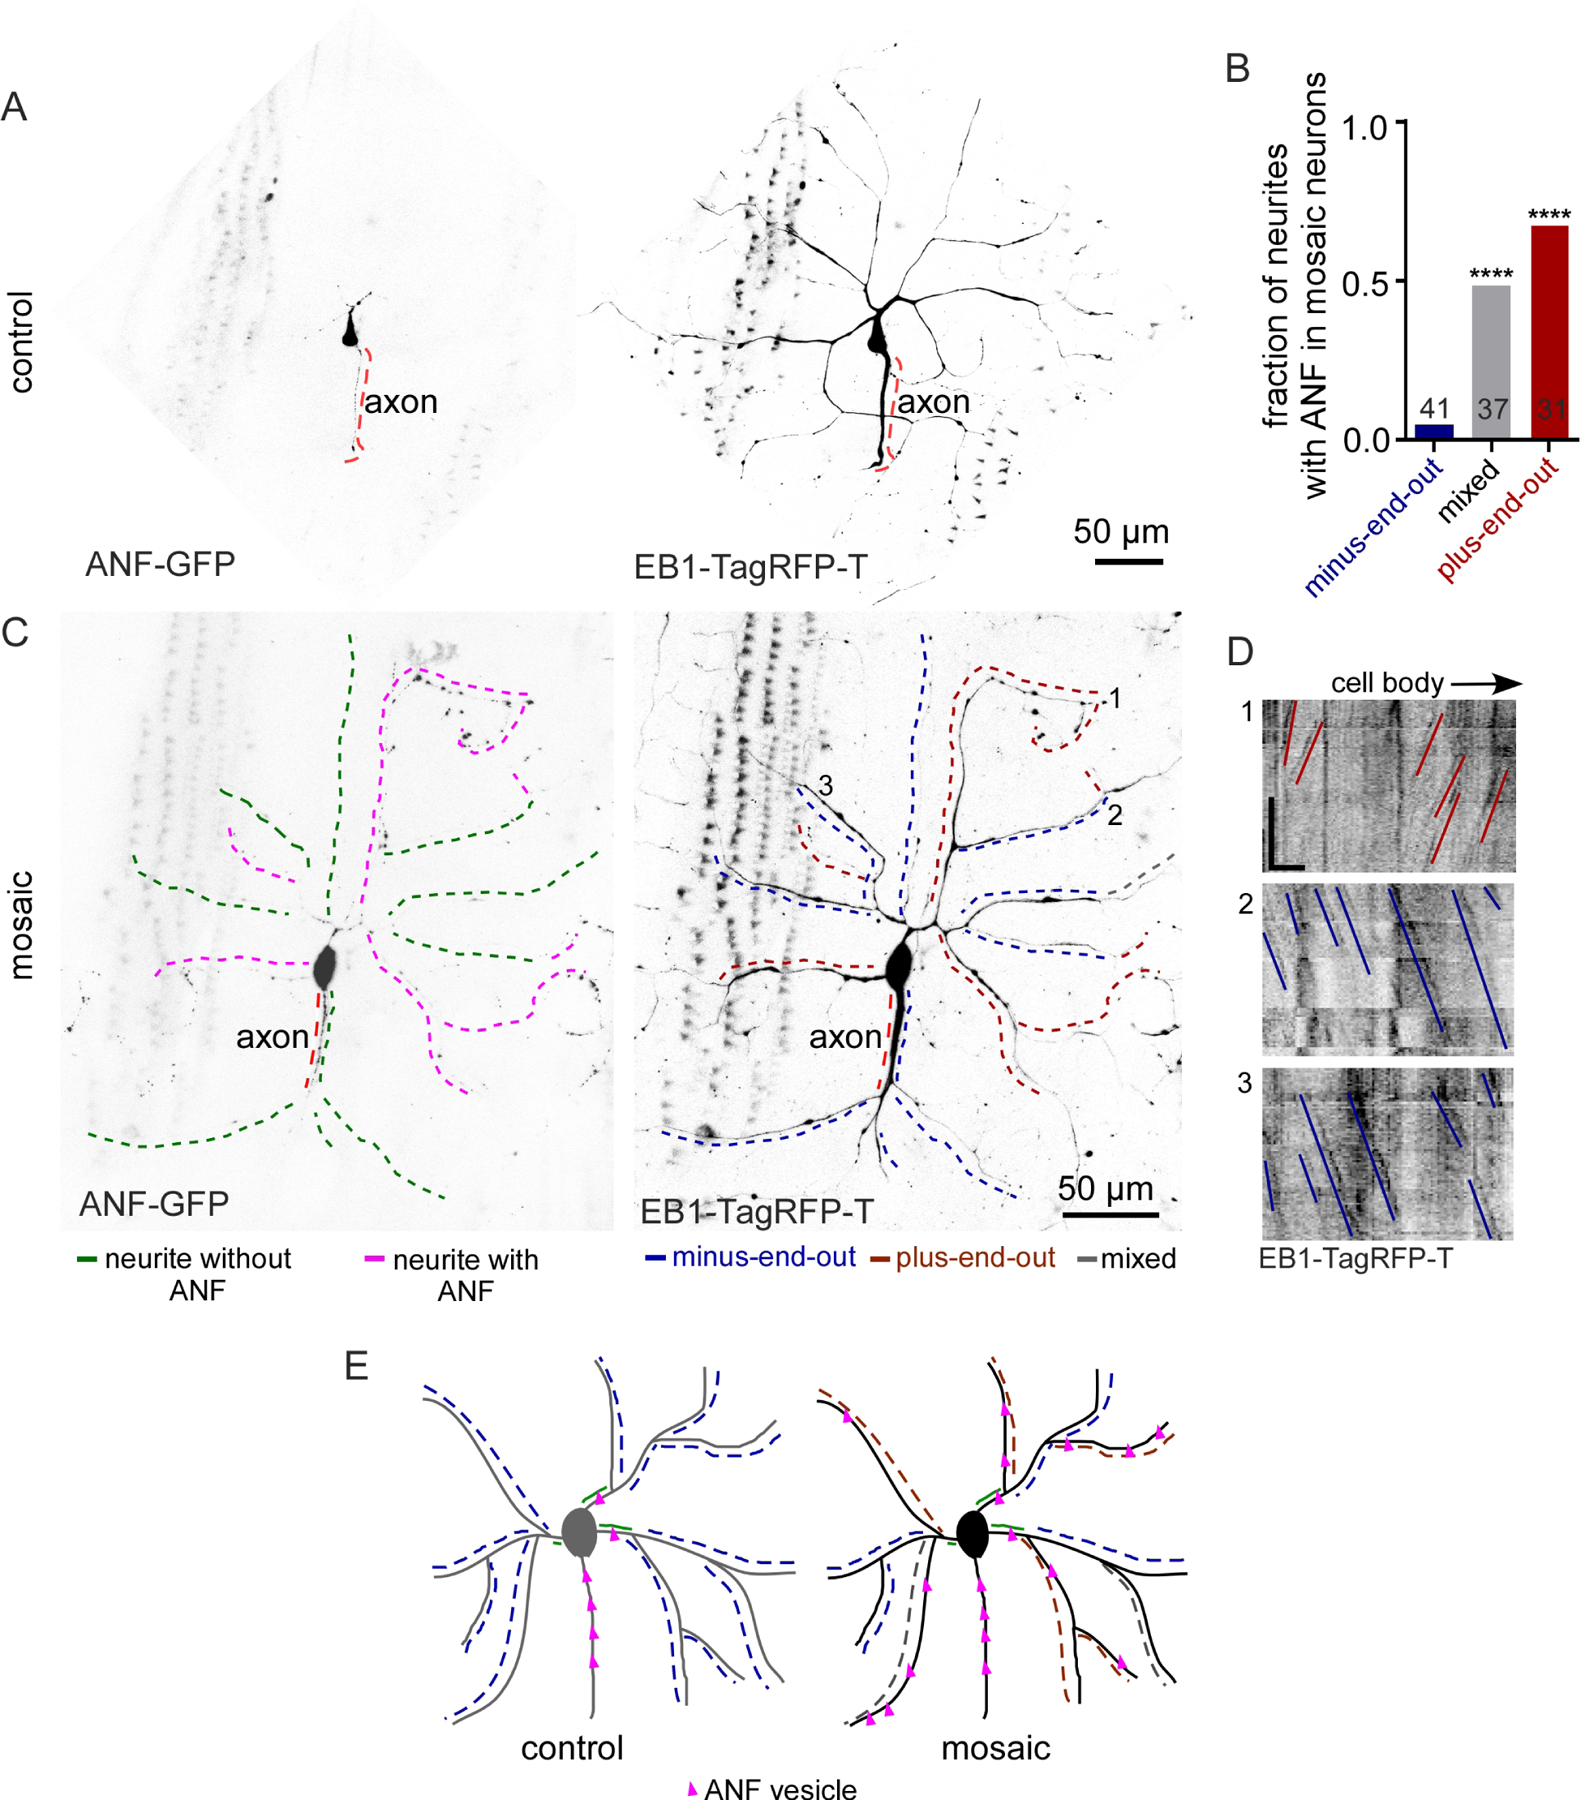
Figure 1. Reduction of Patronin generates mosaic dendrite arbors with plus-end-out and minus-end-out regions emerging from minus-end-out roots.

A. Representative image of a class IV ddaC (dorsal dendrite arborization-C) neuron expressing UAS-EB1-GFP and UAS-Patronin RNAi under 477-Gal4 in a 3-day-old Drosophila larva. The black dotted line labels the axon. The red and blue dashed lines indicate the regions of neurites/dendritic branches with plus-end-out microtubules and minus-end-out microtubules respectively. The grey dotted lines mark neurites with mixed microtubule polarity. The green solid line marks the base of a dendrite.
B. Representative kymographs of EB1-GFP controlled by 477-Gal4 from time-lapse videos of neurites from control and mosaic (Patronin RNAi) dendrite arbors. γ-Tubulin-37c-RNAi was used as the control RNAi – this gene is maternally expressed and does not contribute to somatic function (Wiese, 2008). Blue lines mark the minus-end-out microtubules while red lines mark the plus-end-out microtubules. Scale bar: x axis = 5 µm, y axis = 60 seconds.
C. Quantification of dendritic branches expressing EB1-GFP under 477-gal4 displaying different microtubule polarities: plus-end-out microtubules (>90%), minus-end-out microtubules (>90%) and mixed polarity. Numbers on the graphs are the total number of branches collected for each group from 15 animals.
D. Representative kymograph from time-lapse video of a segment from the base of the mosaic dendrite arbor where the blue lines label minus-end-out microtubules. Quantification of polarity of microtubules in the base of the control and mosaic arbors is shown in the graph. Numbers on the graphs are the total number of branches collected from 12 animals.
E. Representative image of a class IV ddaC neuron expressing EB1-TagRFP-T and Patronin RNAi under ppk-gal4 in a 3-day-old Drosophila larva. The black dotted line labels the axon. Red and blue dashed lines mark the neurites/dendritic branches with plus-end-out microtubules and minus-end-out microtubules respectively.
F. Representative kymographs from time-lapse videos of a segment of neurites expressing EB1-TagRFP-T under ppk-gal4 from mosaic dendrite arbors are shown. Blue lines mark minus-end-out microtubules while red lines mark plus-end-out microtubules. Scale bar: x axis = 10 µm, y axis = 60 seconds.
G. Schematic diagrams of control and mosaic (Patronin RNAi) neurons are shown.
H. The fraction of dendritic branches with different microtubule polarity in individual neurons (same color code as in C) are compared between 477-gal4 and ppk-gal4. The distribution in each neuron is plotted in the graphs.
