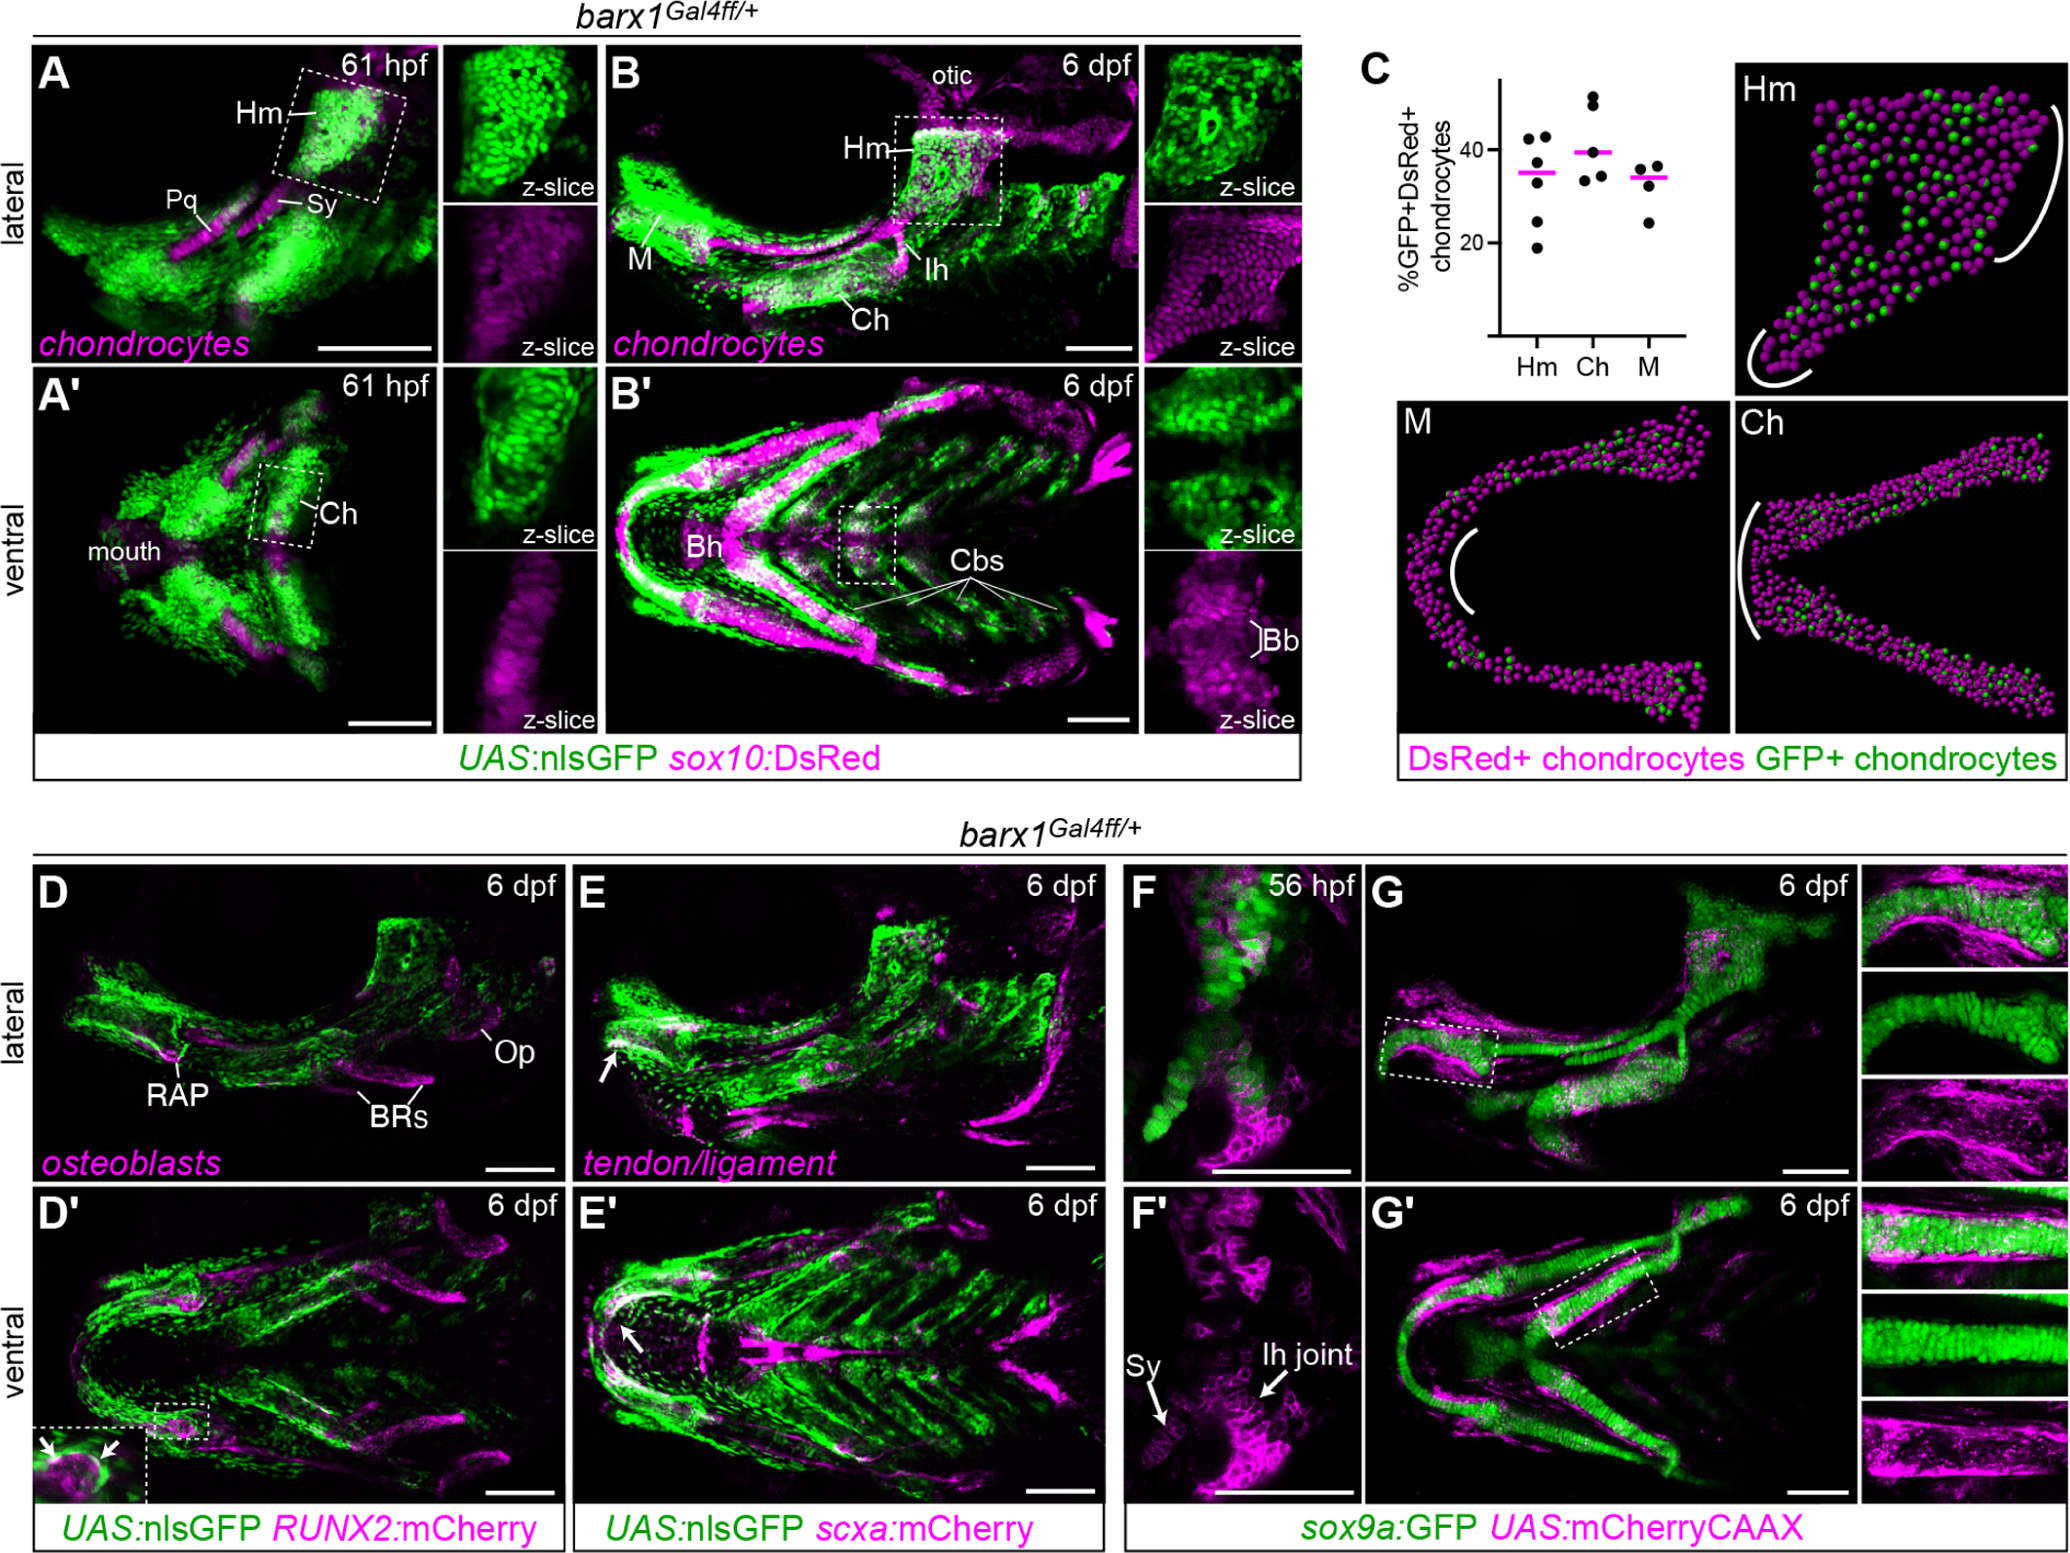
Fig. 3. barx1-lineage cells give rise to facial cartilage.

A-B, Live imaging of barx1Gal4ff; UAS:nlsGFP; sox10:DsRed embryos at 61 hpf and 6 dpf reveals colocalization of barx1-lineage GFP+ cells with DsRed+ chondrocytes in most facial cartilages. Enlarged single-channel z-slice views of the boxed regions are shown to the right of each main panel, illustrating the high degree of GFP/DsRed colocalization in the Hm and Ch cartilages and the absence of GFP in the midline basibranchial cartilage (Bb). GFP expression is also present in perichondral cells and other unidentified mesenchyme. Bh, basihyal; other labels as in the Fig. 1 legend. C, Colocalization analysis between barx1Gal4ff; UAS:nlsGFP and sox10:DsRed at 6 dpf. Graph shows the percentage of double-positive chondrocytes among all chondrocytes counted in the given element. Four to six biological replicates were counted for each element using Imaris. Representative spot-transformed images are shown, with areas depleted for GFP+ cells indicated with white lines. D, Minimal colocalization between GFP and RUNX2:mCherry indicates that most RUNX2+ intramembranous bone osteoblasts derive from barx1-negative precursors or turned barx1 off very early in arch development. Double-positive cells were occasionally observed in the perichondrium (arrows in inset) and likely correspond to perichondral osteoblasts engaged in the early stages of perichondral ossification. Op, opercle bone; BRs, branchiostegal ray bones; RAP, retroarticular process. E, Minimal colocalization between GFP and scxa:mCherry indicates that most tendon/ligament cells are also not recently derived from barx1lineage cells. The major exception was the GFP+ tenocytes lining the posterior rim of Meckel’s cartilage (white arrows). Lateral views shown in top panels; ventral views in A’-D’. F, In barx1Gal4ff; UAS:mCherryCAAX embryos, mCherry expression is detectable in the Sy and Ih joint regions at the onset of definitive chondrogenesis at 56 hpf. G, At 6 dpf, barx1-driven mCherry expression is largely excluded from differentiated sox9a:GFP+ chondrocytes but apparent in the perichondrium. Enlarged single-channel projection views of the boxed regions are shown to the right of each main panel, showing minimal mCherry expression within GFP+ chondrocytes. Images are maximum intensity projections (mips) unless otherwise noted. Scale bars = 100 μm.
