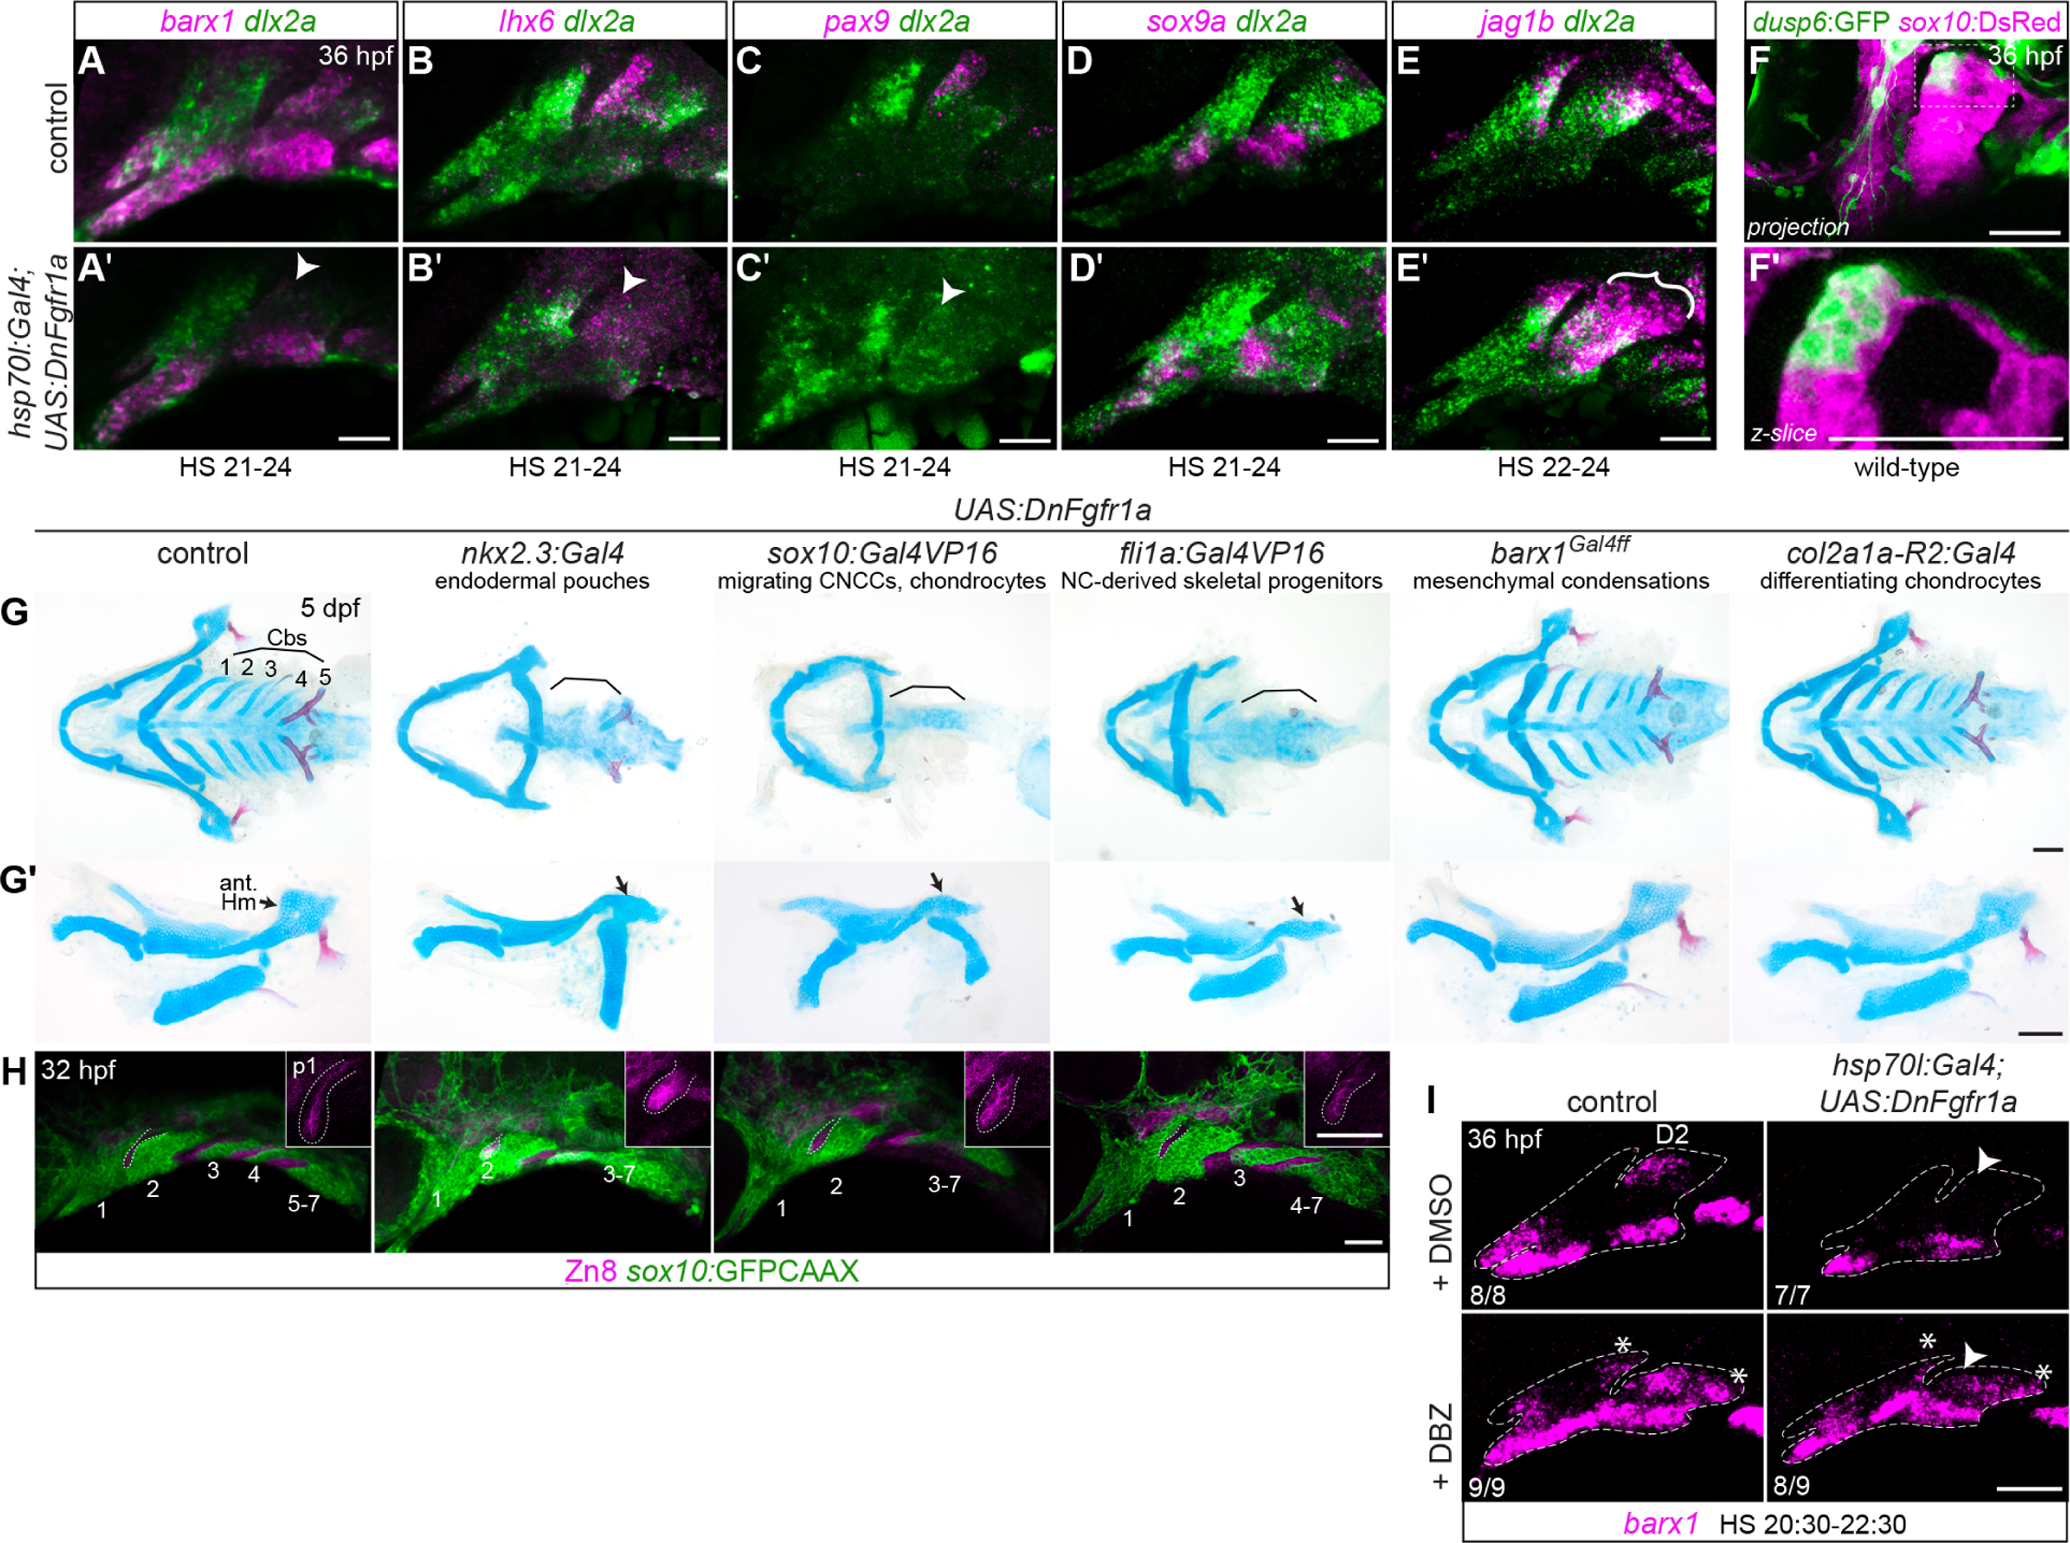
Fig. 4. Intersection of Fgf and Notch signaling positions dorsal mesenchymal condensations.

A-E, Effects of transient systemic inhibition of Fgf signaling on condensation-related gene expression. Transgenic hsp70l:Gal4; UAS:DnFgfr1a embryos were heat-shocked for the indicated durations and then fixed at 36 hpf. dlx2a (green) labels all arch NCCs. A-C, Expression of MC genes barx1, lhx6, and pax9 was consistently weakened in Fgf-inhibited embryos. Diminished expression in the D2 MC is noted with arrowheads. D, Pre-PCC sox9a expression is not appreciably affected by Fgf inhibition. E, jag1b expression expands ventrally and across the anterior-posterior axis of the dorsal second arch in Fgf-inhibited embryos. F, Enrichment of dusp6:GFP reporter expression in the anterior dorsal second arch. sox10:DsRed marks all CNC-derived cells at this stage. G, Expression of dominant-negative Fgfr1a under different cell-type specific Gal4 drivers affects facial cartilage development. Full viscerocrania are shown as ventral preparations in G; dissected mandibular and hyoid cartilages are shown from the lateral perspective in G’. Brackets highlight the missing Cbs; black arrows point to the anterior hyomandibula cartilage. H, Segmentation of the posterior arches is disrupted in DnFgfr1a transgenics that lose posterior arch cartilages. sox10:GFPCAAX marks NC-derived cells, and Zn8 immunostaining marks pharyngeal epithelia. Arches are numbered, and dotted lines show the position of the first pharyngeal pouch. Insets are enlarged single optical sections of the first pouch (p1) stained with Zn8. I, Epistatic effects of Fgf and Notch signaling on dorsal barx1 expression. When Fgf signaling is inhibited, the barx1 D2 domain is lost (arrowhead, top right panel); when Notch is inhibited with the DBZ inhibitor, barx1 is ectopically expressed in dorsal posterior cells (asterisks, bottom left); when both pathways are inhibited, the D2 domain does not recover, but ectopic dorsal posterior expression is present (bottom right). Ratios refer to the number of embryos with the presented phenotype in each group, pooled from two independent iterations of this experiment. Dashed lines indicate approximate arch boundaries. Scale bars in A-E, G, H = 50 μm; in F = 100 μm.
