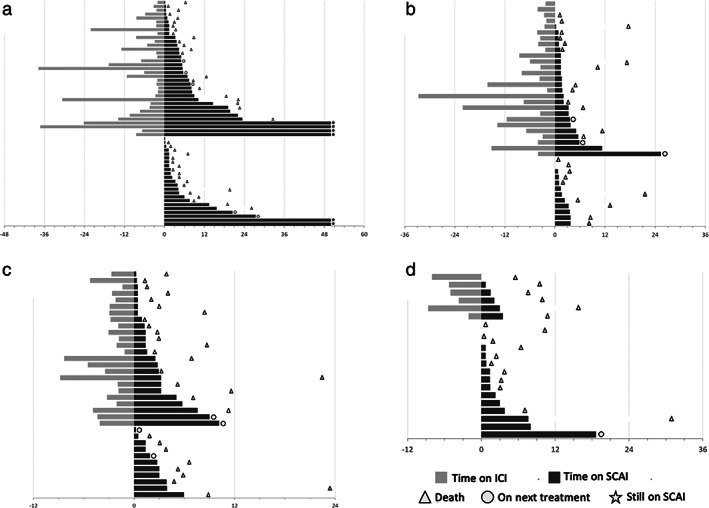
FIGURE 4.

Swimmer plots showing treatment durations of immunotherapy (light gray) and chemotherapy (dark gray) in the different chemotherapy subgroups. (a) paclitaxel bevacizumab; (b) gemcitabine; (c) paclitaxel; (d) pemetrexed. Each bar represents one subject in the study. Time is written in weeks
