Figure 1.
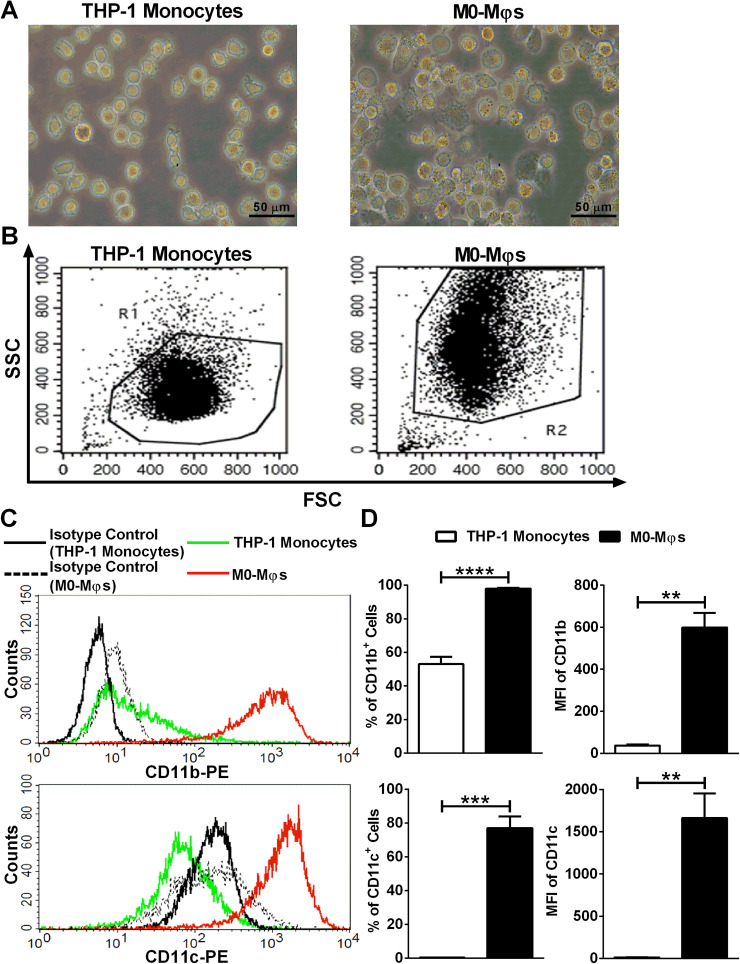
Validation of PMA-induced differentiation of THP-1 monocytes into M0-Mφs. (A) Representative phase contrast inverted microscopy images of THP-1 monocytes and M0-Mφs under × 400 magnification (scale bar: 50 μm). (B) Representative flow cytometry dot plots showing the forward-scatter (FSC) and side-scatter (SSC) properties of THP-1 monocytes and M0-Mφs. (C) Representative flow cytometry histogram plots demonstrating the surface expression of CD11b and CD11c on THP-1 monocytes and M0-Mφs. (D) Column bars representing mean values of the percentage (%) and geometric mean fluorescence intensity (MFI) of CD11b+ and CD11c+ cells from 3 independent experiments (with each condition performed in duplicate). Error bars represent SEM. Statistically significant differences were determined by unpaired t-test **P < 0.01; ***P < 0.001; ****P < 0.0001.

