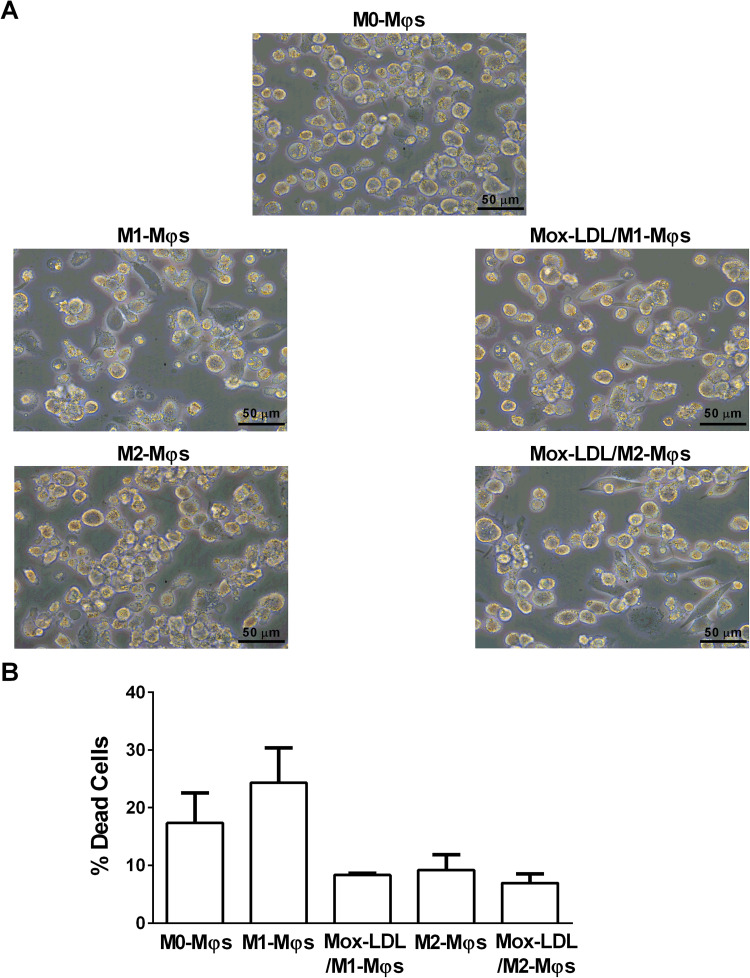
Figure 5.
Effect of Mox-LDL treatment on the morphology and viability of M1-Mφs and M2-Mφs. A) Representative phase contrast inverted microscopy images of M0-Mφs, M1-Mφs, M2-Mφs, and Mox-LDL-treated (at a concentration of 50 μg/ml for 24 h) M1-Mφs (Mox-LDL/M1-Mφs) and M2-Mφs (Mox-LDL/M2-Mφs) under × 400 magnification (scale bar: 50 μm). B) Column bars demonstrating mean values of the percentage (%) of dead (PI-positive cells) M0-Mφs, M1-Mφs, M2-Mφs, Mox-LDL/M1-Mφs and Mox-LDL/M2-Mφs from 3 independent experiments (with each condition performed in duplicate). Error bars represent SEM. Statistically significant differences were determined by one-way ANOVA followed by Tukey's multiple comparison post hoc test.

