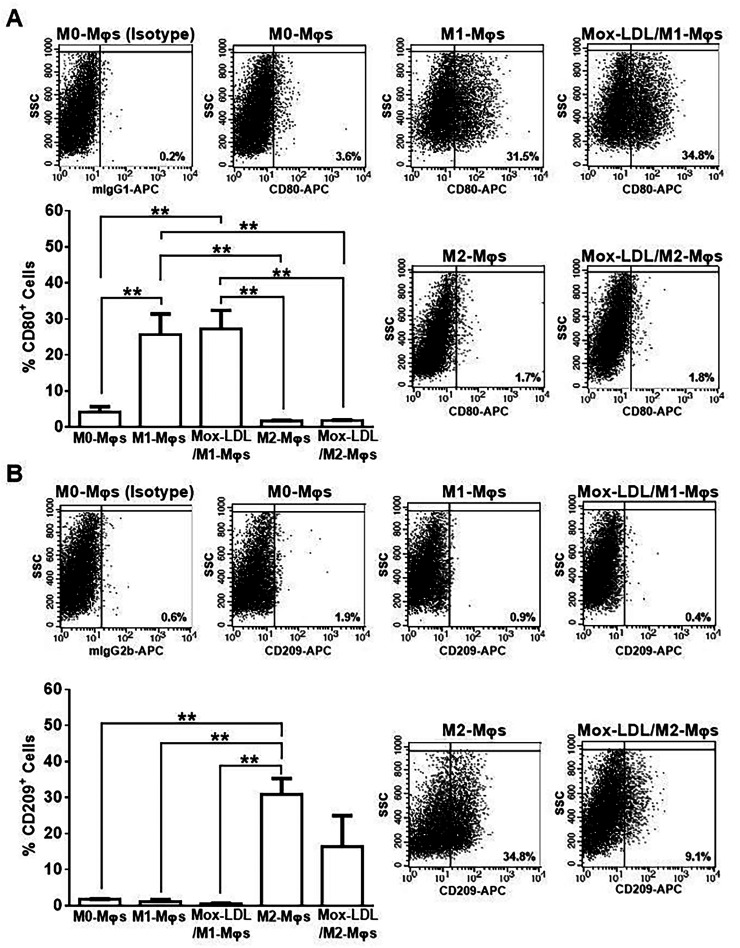
Figure 6.
Analysis of expression of M1-Mφ and M2-Mφ signature receptors on Mox-LDL-treated M1-Mφs and M2-Mφs. Representative flow cytometry dot plots and column bars demonstrating the surface expression of (A) CD80 (M1 marker) and (B) CD209 (M2 marker) on M0-Mφs, M1-Mφs, M2-Mφs and Mox-LDL-treated (at a concentration of 50 μg/ml for 24 h) M1-Mφs (Mox-LDL/M1-Mφs) and M2-Mφs (Mox-LDL/M2-Mφs). Column bars represent mean values of the percentage (%) of CD80+ or CD209+ cells from 3 independent experiments (with each condition performed in duplicate). Error bars represent SEM. One-way ANOVA followed by Tukey's multiple comparison post hoc test was used to calculate statistical significance. **P < 0.01.

