

Abstract
The state-of-the-art unit operation for separation and purification of amino acids is still crystallization, which requires solubility data and melting properties of pure compounds. Since measuring solubility is time-consuming, prediction tools are desired. Further, melting properties are not yet available due to decomposition of amino acids upon slow heating. In this work, melting properties of twenty amino acids (except Met) were measured by Fast Scanning Calorimetry (FSC) with heating rates up to 20 000 K s−1. PC-SAFT was used to predict interactions in amino acid + water systems. Additionally, solubility, pH, and PXRD was measured. By combining FSC and PC-SAFT, the solubility of 15 amino acids was successfully predicted in a wide temperature range in good agreement with the experimental data. Thus, this work provides melting properties of amino acids for the first time and highlights the usefulness of such data to predict material properties such as aqueous solubility of amino acids.
We report the melting properties of amino acids for the first time and highlight the usefulness of such data to predict material properties such as aqueous solubility of amino acids.
Introduction
Commonly proteins are represented by the set of twenty “standard” α-amino acids (AA). These either exist as a monomer or they are bound as building blocks in peptides and proteins.1 Since their isolation in the 19th century the physical and chemical properties of AA have been widely investigated because of their crucial importance in nature and by relevance for industrial processes.2,3 The applied separation unit of fractional crystallization is still state-of-the-art.4,5 This requires basic understanding of the melting temperatures as well as the solubility behavior to further develop and optimize the downstream process.6
However, consistent melting temperatures are still not available for the amino acids. Further, aqueous AA solubility studies have not been checked for consistency. Such studies were carried out in the early 20th century focusing on AA + water.7–12 Many of these works were performed in a narrow temperature range, without pH measurements and analysis of the crystal structure of AA between its pure component and the solid in saturated solutions.
Undoubtedly measuring solubility data is expensive. Hence, prediction of AA solubility in a wide temperature range based on physical properties such as melting properties is highly desired. Unfortunately, conventional methods, e.g. Differential Scanning Calorimetry (DSC), are not applicable to determine the melting properties of AA due to thermal decomposition upon slow heating rates.13 Experimental melting properties is available in literature only for two AA: glycine, l-alanine14 and l-arginine.15
In the current study we continue this work and present the melting properties of twenty proteinogenic AA characterized with Fast Scanning Calorimetry (FSC). FSC with scanning rates up to 20 000 K s−1 has been established as a reliable device to study the melting thermodynamics of thermally labile biomolecules, e.g. bio-polymers,16,17 low molecular mass pharmaceuticals18 and nucleobases.19,20 The experimental melting properties are applied as an input for the thermodynamic framework PC-SAFT to predict the aqueous AA solubility. Additionally, a solid–liquid equilibrium between solid AA and the saturated liquid aqueous phase was applied. Assuming pure solid amino-acid phase the solubility xLi is determined according to Prausnitz21 as:
 |
1 |
 |
2 |
with γLi as the activity coefficient of AA, R the universal gas constant, ΔhSL0i the melting enthalpy at melting temperature, TSL0i the melting temperature, and ΔcSLp0i(T) the temperature-dependent difference between the heat capacities in liquid (L) and solid (S) state of a pure AA. In eqn (2), ΔcSLp0i(T) was assumed to show a linear temperature dependence with  and
and  as the slope and the intercept of the heat capacities, respectively. The solubility increase (decrease) with decrease (increase) of ΔhSL0i, while increase in TSL0i and ΔcSLp0i(T) reduces the slope of the solubility–temperature curve to less temperature-dependency. The influence of the solvent is accounted by γLi, which describes interactions between studied compound and solvent in the liquid phase. The crystal structure of the AA was measured by Powder X-ray Diffraction (PXRD). Eqn (1) is only valid for the neutral form of the molecule, which was confirmed by pH measurements of the saturated solutions.
Detail workflow of this work is illustrated in ESI Fig. S1.† The abbreviation of AA are in ESI Table S1.†
Methodology
Materials and reagents
Twenty proteinogenic AA investigated in this work are listed in ESI Table S1.† All AA were of commercial origin and used without additional purification. The Millipore-Q grade water for the solubility measurements was directly taken in the lab.
Melting measurements with FSC
Experimental FSC melting properties measurements were carried out by using Flash DSC 1 (Mettler Toledo) with the calorimetric twin chip sensor UFS1.22,23 The experimental FSC study of the AA was given in the previous works, where detailed experimental description of FSC method has been presented.14,24
All measurements were conducted under inert atmospheres of dry nitrogen (dew point lower than 150 K) with a flow rate of 50 mL min−1. The sensors were conditioned according to manufacturer's procedure and the temperature was calibrated with recommended calibration metals (indium, bismuth and tin).
The experimental FSC procedure consists of three measurement stages, as presented in the temperature–time profile in ESI Fig. S2.† The starting temperature is set to 303 K to reduce the measuring time, as starting temperature below 303 K requires a cooler and long system equilibration times.
For the first stage (#1 to #4), the temperature range from 303 K to 473 K and constant scanning rate 2000 K s−1 were selected to assure the high reproducibility of the heating and cooling cycles. The reproducibility is indirect proof indicating that sample mass loss due to sublimation and decomposition has not occurred, and that volatile impurities or water were absent. It is also indicating that the sample was measured in its anhydrous form. The sample mass (without silicon oil) is determined in this stage as m0 = Mi [g mol−1] × CSp0i [J K−1]/cSp0i [J mol−1 K−1], where CSp0i [J K−1] is the total heat capacity of the sample from the first FSC stage and cSp0i [J mol−1 K−1] is specific heat capacity obtained DSC measurements (Pyris 1, PerkinElmer, USA).14,16,19,24–26
In the second stage, the melting properties were determined in heating step #5. To improve the thermal contact between the sample and the sensor, silicon oil can be added to the sample before heating step #5. All the samples used in FSC measurements were relatively small (less than 100 ng) and for such small samples, the surface-to-volume ratio is rather high, what leads to increase in mass loss due to sublimation or evaporation at higher temperature. This effect is especially prominent for small molecules like AA. Therefore silicon oil not only improves the thermal contact but additionally coats the sample surface and suppresses the mass loss of the sample due to sublimation or evaporation. The heating rates of step #5 typically ranged from 2000 K s−1 to 10 000 K s−1. However for a few extremely thermally labile AA, e.g. Ile, Asn, Cys, higher heating rates up to 20 000 K s−1 were applied together with silicon oil coating to further minimize the sublimation or evaporation processes. Unfortunately even with these methods, sublimation or evaporation of Met cannot be suppressed enough. The melting and evaporation process were overlapping each other which leads to an unsuccessful determination of melting properties.
In the heating step #5 the shaded grey area in Fig. 1(a) in the temperature range of the melting peak was designated as the melting enthalpy, ΔHSL0i [J], while the onset of the melting peak is a scanning rate dependent melting temperature, TSL0i(β). The specific melting enthalpy, ΔhSL0i, is defined as a ratio ΔhSL0i = ΔHSL0i × M/m0, where M is the molar mass of AA and m0 is the mass of the sample.
Fig. 1. Melting properties of His. (a) Specific heat capacity of His determined experimentally with FSC ( ) and for glass transition step of ultra-fast quenched melted His (without silicon oil) (
 ) and DSC for heat capacity of solid, cSp0i (
 ). The area under the melting peak (
 ) indicates ΔhSL0i, while onset temperature corresponds to TSL0i. ΔcSLp0i is determined at glass transition temperature, ΔcSLp0i(TG0i) and adjusted to melting temperature, ΔcSLp0i(TSL0i). (b) Melting temperature vs. heating rate diagram. Red line is the linear extrapolation to zero heating rate. The uncertainty is the standard deviation of multiple measurements. (c) Enthalpy, ΔHSL0i, of His with respect to sample mass, m0, regardless of the scanning rates β [K s−1]. The slope of the linear fit through zero origin (line) signifies ΔhSL0i. The applied scanning rates were 2000 K s−1 (
 ), 4000 K s−1 (
 up-triangles), 6000 K s−1 (
 ), 8000 K s−1 (
 ) and 10 000 K s−1 (
 ). Solid symbols (without silicon oil), empty symbols (with silicon oil). The melting properties of all twenty proteinogenic AA are shown in ESI Fig. S3 and S4.† The TSL0i, ΔhSL0i, ΔcSLp0i(TG0i) and ΔcSLp0i(TSL0i) for each AA are listed in Table 1. (d) His aqueous solubility as temperature vs. weight fraction diagram. The red area presents the solubility modeling assuming γLi = 1 (eqn (1)) in the range of the uncertainties of the melting properties.
  : TSL0His = (619 ± 7) K. Symbols represent literature data (
 : Kustov,32
 : Amend9). (e) Activity coefficients vs. temperature diagram. (
 : Kustov32) uncertainties are based on the uncertainties of the melting enthalpy.
: PC-SAFT.
: Kustov32) uncertainties are based on the uncertainties of the melting enthalpy.
: PC-SAFT.

After heating step #5, the molten samples without silicon oil were quenched rapidly to retain the sample in the liquid state below the melting temperature without crystallization. During the heating and cooling cycles (#8 to #11) in third stage a step change in specific heat capacity corresponding to glass transition from amorphous solid of AA to liquid (supercooled) state was observed. Due to complications in avoiding sublimation or evaporation mass loss of the samples at high temperatures in the current state of FSC technique, the glass transition can be determined only for half of the 20 proteinogenic AA.
Measurement of solubility
AA are widely investigated and their aqueous solubility data are readily available in literature. Most of the studies are carried out by using the gravimetric method. However, in some cases a discrepancy between literature data and experimental values is observed. In this work an excess amount of solute is added to water till the saturated solution in equilibrium with the solid solute is formed. The compounds were shaken and equilibrated isothermally (at least 72 h) to ensure the solid–liquid equilibrium is reached. After this a defined amount of the saturated liquid phase is withdrawn and weighed. The sample solution is placed in a drying chamber and a vacuum chamber to ensure total evaporation of the water. The remaining solid was weighed again and thus the solubility determined. Additionally often pH values of the saturated solutions and crystal-structure studies of solid phase are missing, which are important since the crystal structure of the pure compound and the solid compound in equilibrium state is not allowed to change during the solubility determination and solubility model. In order to complete the missing information about crystal structure and pH values, AA solubility (for all 20 AA) was determined gravimetrically at T = 298.15 K in three independent unbuffered aqueous solutions. The solutions were mixed for 24 h and left without further shaking for equilibration for 48 h. Then 200 μL of the saturated liquid phase was withdrawn for the solubility determination. The pH measurement of the unbuffered saturated solutions in solid–liquid equilibrium, as well as, the crystal structure of the initial pure AA (from the supplier), and of the solid phase equilibrated with saturated liquid phase were determined using pH meter with a standard uncertainty of ±0.01 and Powder X-ray Diffractometer (PXRD, Miniflex 600, Rigaku, Japan, operating temperature (295.15 K) and pressure (1 atm), speed scan 5° min−1 from 2° to 35° in 0.02° steps, voltage 40 kV, current 15 mA, type of radiation Cu Kα anode), respectively. All the pH values of the saturated solutions are listed Table 3 and the PXRD diffractograms are shown in the ESI Fig. S25–S34.†
Solubility wsat298.15 K, pH values of saturated solutions under study (uncertainties represents the standard deviations of multiple measurements, isoelectric point (pI) from literature and melting properties used in PC-SAFT: melting temperature TSL0i, melting enthalpy ΔhSL0i and the slope ( ,
,  ) and interception (
 ,
,  ) of the heat capacity of liquid and solid, and difference in the heat capacity at melting temperature ΔcSLp0i(TSL0i).
| w sat /g g−1 | pHsat298.15 K | pI36 | T SL /K | ΔhSL0i/kJ mol−1 |
 /J mol−1 K−2 /J mol−1 K−2
|
 /J mol−1 K−1 /J mol−1 K−1
|
 /J mol−1 K−2 /J mol−1 K−2
|
 /J mol−1 K−1 /J mol−1 K−1
|
ΔcSLp0i(TSL0i)/J mol−1 K−1 | |
|---|---|---|---|---|---|---|---|---|---|---|
| AA with non-polar substituents | ||||||||||
| Gly | 0.2019 ± 0.0020b | 6.32 ± 0.04 | 5.97 | 569a | 24.96a | 0.225 | 62.681 | 0.266 | 21.033 | 18.59 |
| Ala | 0.1415 ± 0.0015b | 6.33 ± 0.02 | 6.00 | 608a | 25.99a | 0.267 | 64.148 | 0.324 | 24.225 | 5.26 |
| Val | 0.0553 ± 0.0006b | 6.08 ± 0.07 | 5.96 | 529 | 46.72 | 0.351 | 106.488 | 0.453 | 32.573 | 20.00 |
| Leu | 0.0237 ± 0.0003b | 5.68 ± 0.15 | 5.98 | 518 | 49.09 | 0.525 | 71.622 | 0.577 | 24.322 | 10.15 |
| Ile | 0.0329 ± 0.0003b | 6.22 ± 0.14 | 6.02 | 595 | 47.11 | 0.459 | 87.228 | 0.512 | 35.624 | 20.39 |
| Pro | 0.6365 ± 0.0154b | 7.26 ± 0.07 | 6.30 | — | — | — | — | — | — | — |
| AA with polar substituents | ||||||||||
| Serc | 0.2867 ± 0.0123bb | 6.01 ± 0.02 | 5.68 | 519 | 32.98 | 0.267 | 121.318 | 0.346 | 31.028 | 49.38 |
| Thr | 0.0894 ± 0.0008b | 5.87 ± 0.01 | 5.60 | 587 | 36.64 | 0.379 | 125.276 | 0.406 | 47.019 | 62.18 |
| AA with acidic substituents | ||||||||||
| Asp | 0.0057 ± 0.0002b | 3.05 ± 0.01 | 2.77 | 610 | 35.73 | 0.176 | 213.341 | 0.397 | 37.182 | 41.37 |
| Asn | 0.0267 ± 0.0016b | 5.13 ± 0.05 | 5.41 | — | — | — | — | — | — | — |
| Glu | 0.0088 ± 0.0003b | 3.28 ± 0.04 | 3.22 | 566 | 48.24 | 0.321 | 147.115 | 0.481 | 32.014 | 24.33 |
| Gln | 0.0405 ± 0.0002b | 5.01 ± 0.04 | 5.65 | 589 | 51.96 | 0.474 | 129.528 | 0.500 | 34.849 | 79.19 |
| AA with basic substituents | ||||||||||
| Arg | 0.1639 ± 0.0034b | 11.45 ± 0.02 | 10.8 | 558 | 28.64 | 0.326 | 265.689 | 0.690 | 27.698 | 34.83 |
| His | 0.0414 ± 0.0003b | 7.75 ± 0.05 | 7.59 | 619 | 56.01 | 0.507 | 152.902 | 0.537 | 21.854 | 112.80 |
| Lys | 0.5197 ± 0.1256b | 10.66 ± 0.10 | 9.74 | — | — | — | — | — | — | — |
| AA with aromatic substituents | ||||||||||
| Phe | 0.0291 ± 0.0007b | 5.99 ± 0.20 | 5.48 | 579 | 60.66 | 0.496 | 280.823 | 0.635 | 15.731 | 184.37 |
| Tyr | 0.0006 ± 0.0001b | 5.77 ± 0.34 | 5.66 | 678 | 49.77 | 0.664 | 93.511 | 0.681 | 19.229 | 62.74 |
| Trp | 0.0138 ± 0.0001b | 5.08 ± 0.11 | 5.89 | 620 | 65.55 | 0.351 | 289.570 | 0.758 | 15.771 | 21.82 |
| AA with sulfuric substituents | ||||||||||
| Cys | 0.1419 ± 0.0060b | 5.14 ± 0.03 | 5.74 | — | — | — | — | — | — | — |
| Met | 0.0536 ± 0.0014b | 5.91 ± 0.03 | 5.07 | — | — | — | — | — | — | — |
PC-SAFT
The successful prediction of AA solubility using eqn (1) requires the corresponding activity coefficient and experimental melting properties. The activity coefficient is the ratio of the fugacity coefficient φLi at the solubility mole fraction to the fugacity coefficient φL0i of the pure-component. In this work the PC-SAFT (Perturbed-Chain Statistical Associating Fluid Theory) equation of state is used and the fugacity coefficient is expressed as follows
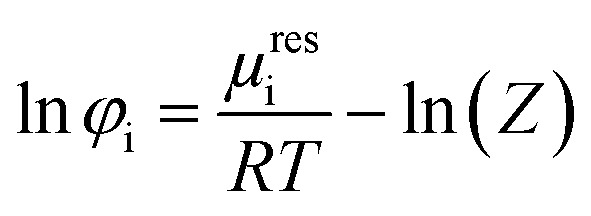 |
3 |
where μresi represents the residual chemical potential and Z the compressibility. The calculation of μresi and Z requires the residual Helmholtz energy ares which is expressed in this work as
| ares = ahc + adisp + aassoc | 4 |
where ahc, adisp and aassoc are the Helmholtz energy contributions “hard chain”, “dispersion” and “association”, respectively. In this work the original PC-SAFT from Gross and Sadowski26 is used, where all required contributions have already been implemented. For mixtures (here water + AA), the conventional Berthelot–Lorentz combining rules were applied to describe the interactions between two components i and j
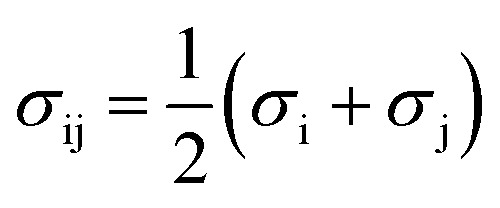 |
5 |
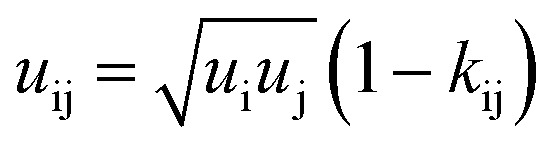 |
6 |
where kij is the binary interaction parameter to describe deviations from the geometric mean of the dispersion-energy parameters of two components i and j (i.e., water and AA). The interaction parameter kij was fitted to osmotic-coefficient data at T = 298.15 K. For some AA, a linearly temperature-dependent binary interaction parameter kij(T) was available in the literature, expressed as:
| kij(T) = kij298.15 K + kijT (T − 298.15 K) | 7 |
In this work kij(T) was fitted to solubility data at higher temperatures.
In the current work the AA were considered as associating fluids, and each one association site was assigned for the amine group and for the carboxylic group, respectively. In case of specific side chains of the AA, additional association site were added depending on a proton donator (e.g. Glu 1 : 2) or proton acceptor (Gln 2 : 1). The PC-SAFT pure-component parameters for most of the AA are already published11 and will be utilized in this work, except for Glu and Asp with improved parameters, and for Trp with completely new parameters (listed in Table 2). The pure-component parameters were fitted to osmotic-coefficient data and density data of aqueous solutions at T = 298.15 K. For some further AA new experimental data for osmotic coefficients and mixture density was added in this work. The diagrams of the fitted osmotic coefficients and mixture densities are shown in Fig. S5–S24 in the ESI.† Water was modeled with the 2B association scheme with a temperature-dependent segment diameter as it was used already in our previous work.14 The PC-SAFT pure-component parameters as well as binary interaction parameters between the AA and water according eqn (6) used in this work are listed in Table 2.
PC-SAFT pure-component parameters and binary interaction parameters used to evaluate kij according to eqn (7). Solubility ratio of one AA at two temperatures w323.15 K/w298.15 K, ARD between PC-SAFT and experimental solubility for Ndp data points, activity coefficients in saturated solutions at T = 298.15 K, and PXRD transitions.
| m seg | σ i/Å | u i/kB/K | ε AiBi/kB/K | κ AiBi | N | k ij,298.15 K/10−2 | k ij,T K/10−4 | w 323.15 K/w298.15 K | ARD/% | N dp/ref. | γ sat | PXRD trans. | |
|---|---|---|---|---|---|---|---|---|---|---|---|---|---|
| H2O | 1.2047 | a | 353.94 | 2425.67 | 0.045 | — | — | — | — | — | — | — | — |
| AA with non-polar substituents | |||||||||||||
| Glyc | 4.850 | 2.327 | 216.960 | 2598.060 | 0.039 | 2 | −5.85c | — | 1.392 | 3.84 | 10/36 | 0.305 | — |
| Alac | 5.465 | 2.522 | 287.590 | 3176.600 | 0.082 | 2 | −6.12c | 2.91c | 1.292 | 1.66 | 10/11 | 0.235 | — |
| Valb | 7.485 | 2.589 | 306.410 | 3183.800 | 0.039 | 2 | −7.57b | 3.85b | 1.223 | 2.07 | 7/37 | 0.059 | — |
| Leub | 8.304 | 2.700 | 330.000 | 3600.000 | 0.020 | 2 | −6.39b | 5.00d | 1.245 | 3.63 | 19/11 | 0.129 | — |
| Ileb | 8.241 | 2.586 | 281.884 | 2207.529 | 0.001 | 2 | −8.75b | 2.70b | 1.199 | 4.60 | 8/38 | 0.043 | — |
| Prob | 6.981 | 2.548 | 289.720 | 5527.750 | 0.036 | 2 | −6.99b | — | 1.192 | — | — | — | x |
| AA with polar substituents | |||||||||||||
| Serb | 7.024 | 2.284 | 236.920 | 2671.930 | 0.039 | 3 | −2.57b | 4.00d | 1.526 | 0.76 | 5/12 | 0.193 | x |
| Thrb | 6.329 | 2.606 | 325.370 | 2519.410 | 0.039 | 3 | −2.78b | 1.25d | 1.388 | 0.44 | 8/39 | 0.465 | — |
| AA with acidic substituents | |||||||||||||
| Aspd | 5.827 | 2.522 | 287.625 | 2544.234 | 0.041 | 3 | 1.45d | — | 1.889 | 8.17 | 16/40 | 5.825 | — |
| Asnb | 3.000 | 3.367 | 280.000 | 3265.670 | 0.044 | 3 | 0.00b | — | 2.879 | — | — | — | x |
| Glud | 6.831 | 2.560 | 227.192 | 2544.234 | 0.041 | 3 | −4.45d | — | 2.501 | 4.52 | 23/41 | 0.324 | — |
| Glnd | 9.289 | 2.360 | 273.555 | 2637.341 | 0.020 | 3 | −5.18d | — | 1.992 | 3.33 | 8/42 | 0.114 | — |
| AA with basic substituents | |||||||||||||
| Argb | 9.908 | 2.657 | 349.710 | 2555.450 | 0.039 | 4 | −1.45b | — | 1.848 | 10.1 | 11/37 | 0.969 | — |
| Hisd | 9.088 | 2.473 | 281.954 | 2640.981 | 0.078 | 3 | −3.89d | 0.91d | 1.517 | 6.62 | 11/32 | 0.205 | — |
| Lysb | 11.673 | 2.378 | 301.210 | 3787.310 | 0.033 | 3 | −7.07b | — | 1.358 | — | — | x | |
| AA with aromatic substituents | |||||||||||||
| Phed | 9.310 | 2.690 | 391.827 | 3206.094 | 0.010 | 2 | −5.18d | — | 1.502 | 14.2 | 17/7 | 1.755 | — |
| Tyrb | 8.139 | 2.280 | 289.370 | 2500.000 | 0.040 | 3 | 0.0227 | — | 1.934 | 18.8 | 11/36 | 11.17 | — |
| Trpd | 10.577 | 2.825 | 260.641 | 2563.249 | 0.024 | 3 | −7.68 | 1.78d | 1.493 | 1.66 | 11/36 | 0.021 | — |
| AA with sulfuric substituents | |||||||||||||
| Cysb | 7.739 | 2.384 | 322.910 | 1964.000 | 0.010 | 3 | −2.35 | — | 1.755 | — | — | — | x |
| Metb | 16.026 | 2.150 | 220.370 | 1964.000 | 0.010 | 3 | −1.43 | 1.57 | 1.416 | — | — | — | — |
Results
Experimental melting properties
The melting properties of 19 proteinogenic AA (except Met) were characterized experimentally with FSC. The FSC experimental results for His as a representation are presented in Fig. 1(a–c), while for all other AA in ESI Fig. S3 and S4.†
Ideally, a direct determination of ΔcSLp0i at TSL0i is preferable from the melting curve. However, this is not possible for some AA due to the mass loss caused by sublimation or evaporation after melting. The mass loss of the sample is indicated by a baseline drop below cSp0i after the melting, even though the sample was cooled down rapidly right after the melting to minimize the mass loss at high temperature. If complete mass loss and crystallization are avoided, a glass transition step at TG0i from glassy to supercooled liquid AA is shown as solid green line.
For low volatile samples such His or Arg (ESI Fig. S3†), the liquid phase immediately after the melting (solid red line) is in accordance with the cLp0i above glass transition. This indicates that the linear extrapolation from cLp0i of the glass transition to TSL0i is applicable. For consistency reasons this extrapolation was applied for all AA with measured glass transition. For high volatile AA (Gly, Ala, Val, Leu, Ile, Pro, Lys, Phe, Cys) without measurable glass transition, ΔcSLp0i(T) was estimated as explained in the discussion.
The cLp0i of the glass transition was fitted linearly with  as slope and
  as intercept, while the cSp0i determined from DSC as solid blue line is fitted linearly with
  and
and  . The heat capacity of crystal and glass are assumed to be equal, especially at temperatures close to TG. This assumption is commonly accepted, e.g. indomethacin,27 saccharides,28o-terphenyl,29 selenium,30 poly-p-dioxanone.31 The heat capacity difference between crystal and glass of such components does not differ by more than 5 to 10%. This difference is also within the uncertainty of our investigation. Nevertheless, we have to acknowledge that there is a difference in the heat capacity, which may influence the result of our investigation. Nevertheless, in sum the difference between heat capacity of solid and glass phases are worst-case assumed to be <10%. Thus, heat capacity of solid was set equal to the glass. This allows indirect determination of ΔcSLp0i(TG0i) at glass transition temperature and adjustment to melting temperature, ΔcSLp0i(TSL0i), which is required in eqn (1).24
In Fig. 1(b), the melting temperature was determined by extrapolating the onset melting temperature at different scanning rates to zero scanning rate β, ΔTSL0i(β → 0), considering the thermal lag and possible superheating.33–35 The slope of the linear fit through zero origin in Fig. 1(c) signifies the specific melting enthalpy, ΔhSL0i, where the ΔHSL0i depends linearly on the sample mass, regardless of the scanning rates. Samples were measured with and without encapsulating in silicon oil. The good agreement of melting temperatures and melting enthalpies between both samples indicates the absence of chemical interaction between AA and silicon oil.
The experimental melting properties measured by FSC are listed in Table 1.
Molar mass (M), experimental glass and melting properties determined with FSC in this work (TSL0i, TG0i, ΔhSL0i, ΔsSL0i, ΔcSLp0i(TG0i) and ΔcSLp0i(TSL0i)) of the pure 19 proteinogenic AA. The uncertainties represents the standard deviations of multiple measurements.
| M/g mol−1 | T G /K | T SL /K | ΔhSL0i/kJ mol−1 | ΔsSL0i/kJ mol−1 | ΔcSLp0i(TG0i)/J mol−1 K−1 | ΔcSLp0i(TSL0i)/J mol−1 K−1 | |
|---|---|---|---|---|---|---|---|
| AA with non-polar substituents | |||||||
| Glya | 75.07 | — | 569 ± 9 | 22 ± 3 | 0.038 ± 0.005 | — | — |
| Alaa | 89.10 | — | 608 ± 9 | 23 ± 3 | 0.038 ± 0.005 | — | — |
| Val | 117.15 | — | 529 ± 7 | 44 ± 6 | 0.083 ± 0.011 | — | — |
| Leu | 131.18 | — | 518 ± 8 | 43 ± 5 | 0.082 ± 0.011 | — | — |
| Ile | 131.18 | — | 595 ± 7 | 43 ± 6 | 0.083 ± 0.011 | — | — |
| Pro | 115.14 | — | 527 ± 7 | 19 ± 3 | 0.036 ± 0.005 | — | — |
| AA with polar substituents | |||||||
| Ser | 105.10 | 337 ± 2 | 519 ± 7 | 28 ± 3 | 0.053 ± 0.006 | 64 ± 3 | 50 ± 3 |
| Thr | 119.12 | 355 ± 4 | 587 ± 9 | 34 ± 5 | 0.058 ± 0.035 | 69 ± 1 | 63 ± 9 |
| AA with acidic substituents | |||||||
| Asp | 133.11 | 386 ± 16 | 610 ± 7 | 35 ± 5 | 0.057 ± 0.006 | 93 ± 4 | 42 ± 4 |
| Asn | 132.12 | 466 ± 11 | 582 ± 7 | 33 ± 4 | 0.055 ± 0.007 | 80 ± 2 | 52 ± 2 |
| Glu | 147.13 | 330 ± 5 | 566 ± 7 | 46 ± 5 | 0.078 ± 0.006 | 63 ± 5 | 25 ± 5 |
| Gln | 146.15 | 323 ± 5 | 589 ± 7 | 50 ± 6 | 0.076 ± 0.010 | 79 ± 2 | 80 ± 2 |
| AA with basic substituents | |||||||
| Arg | 174.21 | 362 ± 3 | 558 ± 7 | 28 ± 4 | 0.051 ± 0.007 | 107 ± 5 | 35 ± 5 |
| His | 155.16 | 408 ± 9 | 619 ± 7 | 59 ± 6 | 0.095 ± 0.011 | 120 ± 3 | 113 ± 3 |
| Lys | 146.19 | — | 529 ± 9 | 22 ± 3 | 0.042 ± 0.004 | — | — |
| AA with aromatic substituents | |||||||
| Phe | 165.20 | — | 579 ± 7 | 58 ± 7 | 0.099 ± 0.013 | — | — |
| Tyr | 181.20 | 405 ± 3 | 678 ± 7 | 47 ± 6 | 0.069 ± 0.009 | 65 ± 1 | 63 ± 1 |
| Trp | 204.23 | 433 ± 3 | 620 ± 7 | 60 ± 7 | 0.097 ± 0.012 | 99 ± 4 | 22 ± 4 |
| AA with sulfuric substituents | |||||||
| Cys | 121.16 | — | 604 ± 7 | 45 ± 8 | 0.074 ± 0.014 | — | — |
Already published in previous work.14
Discussion
First, without any thermodynamic model – the activity coefficient γLi is assumed to be one (ideal mixture); this results in direct relation between the melting properties and the solubility according to eqn (1), where low melting temperature and enthalpy correspond to high solubility. The rule is true for the series of basic AA (Arg, His, Lys) as well as for aromatic AA (Phe, Tyr, Trp). However, the rule is not valid for the acidic AA (Asp, Glu) and their amides (Asn, Gln). The amide AA are better soluble in water compared to their acidic pendants despite the fact that the latter have lower melting temperatures and enthalpies. This wrong description of solubility using ideal mixture can only lead to the conclusion that γLi has to be taken into account to describe the interactions in the liquid phase. This can be quantified by another example. The solubility of His in an ideal mixture was calculated using melting properties in the range of their uncertainties. The result is shown as red area in Fig. 1(d). The experimental data of His solubility in water are not within the red area, giving the conclusion that γLi should be lower than one to match solubility according to eqn (1).
In Fig. 1(e) the PC-SAFT predicted γLHis of His of the saturated solutions are presented. This is compared with values determined by using experimental FSC melting properties and experimental solubility data solved by eqn (1) to yield γLi. It can be observed that γLHis values are far away from being one, and that the results of PC-SAFT prediction agrees with the experimental values within FSC uncertainty. The activity coefficients change with the temperature till it approaches unity at the melting temperature. The PC-SAFT predicted values of γsat298.15 K for each AA at T = 298.15 K are listed in Table 2.
PXRD measurements
The hydration of AA has been widely reported in literature.44–49 In this work the PXRD measurement lead to further investigations in terms of possible polymorphs or formation of hydrates. Unfortunately, some AA were found to form hydrates (Ser,12 Lys,50 Asn, Pro), which does not allow the application of eqn (1) since the solid crystal in solution as well as for the melting properties must be the same. All the PXRD measurements were performed for the saturated solutions at T = 298.15 K and are shown in ESI Fig. S25–S34.†
pH measurements
The pH measurement in aqueous solution of AA was conducted in order to ensure that only one neutral species (>99%) was present in the saturated solution. Asp (≈95%), Arg (≈90%), Glu (≈88%) have less neutral species present in the saturated solutions, but this is still sufficient for PC-SAFT modeling, unfortunately not for Lys (≈70%), for which Lys was excluded from the PC-SAFT modeling. The pH values for all AA solutions are listed in Table 3.
Solubility predictions with PC-SAFT
The solubility of all AA was predicted with PC-SAFT based on the experimental melting properties measured with FSC. Prediction means that all PC-SAFT pure-component parameters were fit to non-solubility properties such as osmotic coefficients and mixture densities at T = 298.15 K in water. The deviations between PC-SAFT values and the experimental solubility were quantified with the absolute relative deviations (ARD) according to eqn (8)
 |
8 |
where NP is the number of the available experimental solubility points, xPC-SAFTk and xexpk are the PC-SAFT predicted and the experimental solubility, respectively.
As shown recently12 the ΔhSL0i has the highest influence on the solubility prediction. Unfortunately, ΔhSL0i values from FSC have rather high uncertainty up to 20%, in comparison to the ΔcSLp0i(TSL0i) (up to 5%) and TSL0i (up to 2%). Therefore, FSC experimental results of ΔcSLp0i(TSL0i) and TSL0i were utilized as input for solubility predictions with PC-SAFT directly, i.e. without varying within the experimental uncertainty. In contrast, the ΔhSL0i was adjusted (within the range of uncertainty of the FSC results) to experimental solubility data at 298.15 K. As a result, the FSC data for ΔhSL0i in (Table 1) and the PC-SAFT fit for ΔhSL0i (Table 3) are nearly identical, which proves the general suitability of PC-SAFT method for the mixtures considered in the present work, where the predicted PC-SAFT solubility is in good agreement with experimental solubility Table 2.
Most of the PC-SAFT parameters were already available in the literature.8 These are listed in Table 2 together with binary interaction parameters between water and AA. The parameter kij(T) was applied for AA with a rather low temperature dependency of solubility. Therefore, the solubility ratio between T = 323.15 K and T = 298.15 K should indicate the necessity of a temperature-dependent interaction parameter. Ratio lower than (greater than) 1.5 increases (decreases) the probability of using two such parameters (one parameter).
AA with non-polar substituents
From Fig. 2(a) it was observed that the solubility decreases in the following order Gly > Ala > Val > Leu for T < 450 K. However at higher temperatures, this order is disarranged. This new finding becomes possible only due to the availability of the new experimental melting data from FSC in this work. All non-polar aliphatic AA show a high tendency for sublimation/evaporation after the melting, so no glass transition step could be measured. However, even small values for differences of heat capacities moderately influence the slope of the solubility line. Therefore, heat capacity differences were fit to experimental solubility-temperature curves.
Fig. 2. The temperature-dependent solubilities of AA: triangles represent literature data; empty circles represent the solubility measurements in present study; lines represents PC-SAFT predictions. (a) AA with non-polar substituents: Gly : Lundblad,36
 Amend,9
 : PC-SAFT. Ala
 : Daldrup11
 : Amend,9
 : PC-SAFT. Val
 : Lundblad,36
 Amend,9
 : PC-SAFT. Leu
 : Daldrup,11
 : Amend,9
 : PC-SAFT. (b) AA with non-polar substituents: Ile
 : Zumstein,38
 : Amend9
 : PC-SAFT. Pro
 : Lundblad,36
 : Amend.9 No PC-SAFT modeling due to a crystal change (ESI Fig. S26†). (c) AA with polar substituents: Thr
 : Lundblad,36
 : Amend,9
 : Ferreira,43
 : PC-SAFT. Ser
 : Luk12
 : Amend,9
 : PC-SAFT. (d) AA with basic substituents: His
 : Kustov,32
 : Amend,9
 : PC-SAFT. Arg
 : Yalkowsky,37
 : Amend,9
 : PC-SAFT. Lys
 : Amend.9 No PC-SAFT modeling due to a crystal change (ESI Fig. S32†). (e) AA with acidic substituents: Asn
 : Dalton,7
 : Amend.9 No PC-SAFT modeling due to the crystal structure change (ESI Fig. S29†) Asp
 : Apelblat,40
 : Amend,9
 : PC-SAFT. Gln
 : Yu,42
 : Amend,9
 : Yalkowsky,37
 : PC-SAFT. Glu
 : Matsuo,41
 : Amend,9
 : Yalkowsky,37
 : PC-SAFT. (f) AA with aromatic substituents: Phe
 : Dalton,7
 : Amend,9
 : PC-SAFT. Tyr
 : Yalkowsky,37
 : Amend,9
 : Lundblad,36
 : PC-SAFT. Trp
 : Lundblnd,36
 : Amend,9
 : Dalton,7
 : PC-SAFT.

The aqueous AA solubility of Ile and Pro are shown in Fig. 2(b). Apparently Pro is most soluble in water among the twenty proteinogenic AA. In this case the PXRD results from the present work showed a change in the crystal structure which was referenced to the formation of a hydrate. The exact hydration is at least below THydration ≤ 298.15. As the melting properties belong to the anhydrous form, eqn (1) cannot be applied.
AA with polar substituents
Fig. 2(c) shows that solubility of Ser is higher than of Thr. For Thr the melting properties were taken as measured and the solubility prediction is in good agreement with the literature. For Ser a crystal change was found during the solubility measurement. The crystal change can be referenced to Luk,12 which shows the formation of a hydrate (THydration < 312.15 K). At higher temperatures the anhydrous Ser was formed (confirmed by PXRD), which allows the application of eqn (1). This might explain the slight kink in the solubility curve observed for Ser in Fig. 2(c). The melting properties can only be determined for the anhydrous form. For the PC-SAFT predictions melting temperature and difference in heat capacity was taken from the FSC measurements. The melting enthalpy was adjusted within FSC uncertainty to the only available experimental solubility value at T = 315.15 K. A good agreement between PC-SAFT and experimental solubility-temperature data supports the proposed procedure.
AA with acidic substituents
The acid AA (Asp, Glu) are characterized by a carboxyl group in the side chain and the amides (Asn, Gln) have a primary amide group. These additional polar groups also affect the pH value of the saturated solutions, which corresponds to their isoelectric points (pI). In general, these four AA show very low solubility in water, the amide AA are slightly more soluble than their acidic pendants at their pI (Fig. 2(e)). However, for Asn a hydrate has formed upon equilibration in water.7,9 Unfortunately, solubility literature data of the anhydrous Asn was not available. Hence eqn (1) could not be applied for temperatures below THydration ≤ 298.15 and Asn solubility cannot be predicted. For Glu, Gln and Asp eqn (1) was applied and the results are in good agreement with the literature.
AA with basic substituents
His, Arg and Lys and increase the pH value in unbuffered aqueous solution, resulting in high pI values (Table 3). For Lys the experimental solubility re-measured in this work was higher than the only available literature data,9 see Fig. 2(d). The PXRD diffractograms might hint Lys-hydrate formation in aqueous solutions. Williams et al.,50 observed Lys monohydrate, depending on the relative humidity level to which Lys was exposed. The anhydrous form can only be attained after vacuum drying. Thus, eqn (1) was not applied to Lys. The surprisingly low values for the melting properties (TSL0,Lys = 529 ± 9 K, ΔhSL0,Lys = 22 ± 3 K) indicate possible high solubility of Lys.
For His and Arg no change in crystal structure was detected and the conventional approach was applied. The solubility prediction is in good agreement with the literature data.
AA with aromatic substituents
The aqueous solubility of the aromatic AA are very low (Fig. 2(f)) with order of Phe > Trp > Tyr. The solubility measurements from this work are in good agreement with the literature data. No crystal structure change is detected in the PXRD in aqueous solutions, which allows modeling by application of eqn (1).
Due to high sublimation/evaporation, the glass transition of Phe was unattainable, subsequently the heat capacity difference could not be determined. The heat capacity was estimated to be ΔcSLp0i(TSL0i) = 184.37 J mol−1 K−1 in order to maintain the FSC determined ΔhSL0i within its experimental uncertainty. Modeling solubility without taking into account of ΔcSLp0i would predict a very low ΔhSL0i, which is inconsistent with FSC data. This shows that the heat capacity difference is a very important property, which is unfortunately often neglected in thermodynamic modeling.
For Trp and Tyr the experimental melting properties applied in PC-SAFT are within the uncertainties of the FSC measurement. The predicted solubility of Phe, Trp and Tyr are in good agreement with the experimental solubility data.
AA with sulfuric substituents
The solubility order for sulfuric AA is Cys > Met (ESI Fig. S35†). A crystal structure change for Cys during the measurement was observed. Hence, solubility modeling with eqn (1) was not performed.
The experimental solubility for Met is consistent with the literature data.51 Unfortunately no melting properties could be measured using FSC. Thus solubility modeling is also not possible. No crystal change was observed for both Cys and Met.
Comparison to literature
The classical way of thermodynamic solubility model for components with inaccessible experimental melting properties are performed as follows: different gE models or equations of state were used to calculate the activity coefficients for eqn (1), while simultaneously fitting the melting properties to experimental solubility data. This procedure is still state-of-the art in the literature; however, the results of this approach differ strongly from the FSC-determined melting properties. Additionally, often applied in the literature solubility model differs from the eqn (1) used in this work. For example, the modified Apelblat equation
 |
9 |
which fits the solubility with three independent parameters A, B and C. In this case it is not possible to distinguish the proper melting properties and therefore the comparison to the FSC melting properties is not possible. For this reason the “right side” of each solubility model can be treated as the solubility product KSP, which consist of the solubility xLi and activity coefficient γLi.
| xLi × γLi = KSP = f(T) | 10 |
KSP depends only on the absolute temperature T. This allows the comparison of different solubility models without accounting for the fitting to physically meaningful melting properties or purely adjustable fitting parameters (Fig. 3).
Fig. 3. Solubility product of the AA at 298.15 K.  : this work using eqn (1) (orange).
  : Held, 2011 (ref. 10) using eqn (1).
  : Cao et al., 2013 (ref. 52) using Apelblat eqn (9).
  : Zhang, 2014 (ref. 53) using Apelblat eqn (9),
  : Fan, 2019:54 using Apelblat eqn (9),
  : Marrero and Gani, 2001:55 using group contribution. For Pro, Asn, Lys and Cys the uncertainty at T = 298.15 K based on the FSC measurements of melting properties is shown since a crystal change was detected during the solubility measurements.

In Fig. 3 the solubility product of each AA is shown at T = 298.15 K and T = 323.15 K. In some literature studies the melting properties were calculated by using group contribution methods without further applying it on solubility modeling.37,55 In this case, we applied eqn (1). However, regardless of how the melting properties/adjustable parameter was achieved, it is clear that the literature data differ to the solubility product determined in the current work. The predicted solubility based on the experimental melting properties is in good agreement with the experimental solubility, therefore the solubility product is more precise in comparison to other models in literature.
Conclusions
In this work nineteen proteinogenic AA (except Met) were characterized using FSC and the melting properties were successfully determined. It was shown that the experimentally determined melting properties are indispensable parts of solubility predictions using PC-SAFT. The access to the melting properties not only allows solubility prediction but also the quantification of the activity coefficients, which will give access to future model validation. The combination of FSC and PC-SAFT opens the door to predict solubility of solid compounds that decompose before melting.
Funding
The authors acknowledge funding from German Research Foundation (DFG) with Grants HE 7165/6-1 and CH 1922/1-1.
Conflicts of interest
There are no conflicts to declare.
Supplementary Material
Acknowledgments
Additionally, the authors acknowledge the laboratory technicians Susanne Richter and Nicolette Keil (TU Dortmund) for their time and support during the experimental procedures. The authors gratefully acknowledge the financial support by the German Science Foundation (DFG) with Grants HE 7165/6-1 and CH 1922/1-1.
Electronic supplementary information (ESI) available. See DOI: 10.1039/d0ra08947h
References
- Barrett G. C. and Elmore D. T., Amino acids and peptides, Cambridge University Press, Cambridge, 1998 [Google Scholar]
- Hou Q. Bourgeas R. Pucci F. Rooman M. Sci. Rep. 2018;8(1):14661. doi: 10.1038/s41598-018-32988-w. [DOI] [PMC free article] [PubMed] [Google Scholar]
- Warraich A. A. Mohammed A. R. Perrie Y. Hussain M. Gibson H. Rahman A. Sci. Rep. 2020;10(1):9021. doi: 10.1038/s41598-020-66082-x. [DOI] [PMC free article] [PubMed] [Google Scholar]
- Kempkes L. J. M. van Enckevort W. J. P. CrystEngComm. 2015;17(6):1483. [Google Scholar]
- Pinho S. P. and Macedo E. A., Solubility in Food, Pharmaceutical, and Cosmetic Industries, 2007, pp. 305–322
- Carta R. J. Chem. Eng. Data. 1999;44(3):563. [Google Scholar]
- Dalton J. B. Schmidt C. L. A. J. Biol. Chem. 1933:549. [Google Scholar]
- Dalton J. B. Schmidt C. L. A. J. Biol. Chem. 1934:241. [Google Scholar]
- Amend J. P. Helgeson H. C. Pure Appl. Chem. 1997;69:935. [Google Scholar]
- Held C. Cameretti L. F. Sadowski G. Ind. Eng. Chem. Res. 2011;50(1):131. [Google Scholar]
- Grosse Daldrup J.-B. Held C. Ruether F. Schembecker G. Sadowski G. Ind. Eng. Chem. Res. 2010;49(3):1395. [Google Scholar]
- Luk C.-w. J. Rousseau R. W. Cryst. Growth Des. 2006;6(8):1808. [Google Scholar]
- Wesolowski M. Konarski T. J. Therm. Anal. 1995;43(1):279. [Google Scholar]
- Chua Y. Z. Do H. T. Schick C. Zaitsau D. Held C. RSC Adv. 2018;8(12):6365. doi: 10.1039/c8ra00334c. [DOI] [PMC free article] [PubMed] [Google Scholar]
- Roda A. Santos F. Chua Y. Z. Kumar A. Do H. T. Paiva A. Duarte A. R. C. Held C. Phys. Chem. Chem. Phys. 2020 doi: 10.1039/d0cp04992a. [DOI] [PubMed] [Google Scholar]; , under review
- Cebe P. Hu X. Kaplan D. L. Zhuravlev E. Wurm A. Arbeiter D. Schick C. Sci. Rep. 2013;3:1130. doi: 10.1038/srep01130. [DOI] [PMC free article] [PubMed] [Google Scholar]
- Cebe P. Thomas D. Merfeld J. Partlow B. P. Kaplan D. L. Alamo R. G. Wurm A. Zhuravlev E. Schick C. Polymer. 2017;126:240. [Google Scholar]
- Corvis Y. Wurm A. Schick C. Espeau P. J. Phys. Chem. B. 2015;119(22):6848. doi: 10.1021/acs.jpcb.5b03041. [DOI] [PubMed] [Google Scholar]
- Abdelaziz A. Zaitsau D. H. Kuratieva N. V. Verevkin S. P. Schick C. Phys. Chem. Chem. Phys. 2019;21(24):12787. doi: 10.1039/c9cp00716d. [DOI] [PubMed] [Google Scholar]
- Abdelaziz A. Zaitsau D. H. Mukhametzyanov T. A. Solomonov B. N. Cebe P. Verevkin S. P. Schick C. Thermochim. Acta. 2017;657:47. [Google Scholar]
- Prausnitz J. M. and Lichtenthaler R. N., Molecular thermodynamics of fluid-phase equilibria, 1969 [Google Scholar]
- Mathot V. Pyda M. Pijpers T. Poel G. V. van de Kerkhof E. van Herwaarden S. van Herwaarden F. Leenaers A. Thermochim. Acta. 2011;522(1–2):36. [Google Scholar]
- van Herwaarden S. Iervolino E. van Herwaarden F. Wijffels T. Leenaers A. Mathot V. Thermochim. Acta. 2011;522(1–2):46. [Google Scholar]
- Do H. T. Chua Y. Z. Habicht J. Klinksiek M. Hallermann M. Zaitsau D. Schick C. Held C. RSC Adv. 2019;9(56):32722. doi: 10.1039/c9ra05730g. [DOI] [PMC free article] [PubMed] [Google Scholar]
- Abdelaziz A. Zaitsau D. H. Mukhametzyanov T. A. Solomonov B. N. Cebe P. Verevkin S. P. Schick C. Thermochim. Acta. 2017;657:47. [Google Scholar]
- Gross J. Sadowski G. Ind. Eng. Chem. Res. 2001;40(4):1244. [Google Scholar]
- Kearns K. L. Whitaker K. R. Ediger M. D. Huth H. Schick C. J. Chem. Phys. 2010;133(1):14702. doi: 10.1063/1.3442416. [DOI] [PubMed] [Google Scholar]
- Shamblin S. L. Tang X. Chang L. Hancock B. C. Pikal M. J. J. Phys. Chem. B. 1999:4113. [Google Scholar]
- Chang S. S. Bestul A. B. J. Chem. Phys. 1972;56(1):503. [Google Scholar]
- Chang S. S. Bestul A. B. J. Chem. Thermodyn. 1974:325. [Google Scholar]
- Ishikiriyama K. Pyda M. Zhang G. Forschner T. Grebowicz J. Wunderlich B. J. Macromol. Sci., Part B: Phys. 1998;37(1):27. [Google Scholar]
- Kustov A. V. Korolev V. P. Thermochim. Acta. 2006;447(2):212. [Google Scholar]
- Höhne G. W. H. Cammenga H. K. Eysel W. Gmelin E. Hemminger W. Thermochim. Acta. 1990;160(1):1. [Google Scholar]
- Toda A. Konishi M. Thermochim. Acta. 2014;589:262. [Google Scholar]
- Toda A. Hikosaka M. Yamada K. Polymer. 2002;43(5):1667. [Google Scholar]
- Lundblad R. L. and Macdonald F. M., Handbook of biochemistry and molecular biology, CRC Press, Boca Raton, FL 33487-2742, 2010 [Google Scholar]
- Yalkowsky S. H., He Y. and Jain P., Handbook of Aqueous Solubility Data, CRC Press, Boca Raton, FL 33487-2742, 2010 [Google Scholar]
- Ronald C. Z. Ronald W. R. Ind. Eng. Chem. Res. 1989;28:1226. [Google Scholar]
- Sapoundjiev D. Lorenz H. Seidel-Morgenstern A. J. Chem. Eng. Data. 2006;51(5):1562. [Google Scholar]
- Apelblat A. Manzurola E. J. Chem. Thermodyn. 1997;29:1527. [Google Scholar]
- Matsuo H. Suzuki Y. Sawamura S. Fluid Phase Equilib. 2002;200:227. [Google Scholar]
- Yu Q. Ma X. Xu L. Thermochim. Acta. 2013;558:6. [Google Scholar]
- Ferreira L. A. Macedo E. A. Pinho S. P. Fluid Phase Equilib. 2007;255(2):131. [Google Scholar]
- Goto S. and Isemura T., Annual Meeting of the Chemical Society of Japan, Kyoto, 1964, pp. 1697–1701 [Google Scholar]
- Pominov I. S. Sidorova D. R. Khalepp B. P. UDC. 1971;13:1084. [Google Scholar]
- Kotova D. I. Beiline D. S. Selemenev V. F. Shepeleva O. A. J. Pharm. Chem. 2001;35:221–221. [Google Scholar]
- Goodfellow J. M. Proc. Natl. Acad. Sci. U. S. A. 1982;79:4977. doi: 10.1073/pnas.79.16.4977. [DOI] [PMC free article] [PubMed] [Google Scholar]
- Kim T. K. Jhon M. S. J. Mol. Liq. 1994;59:179. [Google Scholar]
- Vorobev M. M. Baranov A. A. Belikov V. M. Khurgin Y. I. Russ. Chem. Bull. 1996;45:577. [Google Scholar]
- Williams P. A. Hughes C. E. Martin J. Courvoisier E. Buanz A. B. M. Gaisford S. Harris K. D. M. J. Phys. Chem. C. 2016;120(17):9385. [Google Scholar]
- Fuchs D. Fischer J. Tumakaka F. Sadowski G. Ind. Eng. Chem. Res. 2006;45(19):6578. [Google Scholar]
- Cao Z. Hu Y. Li J. Kai Y. Yang W. Fluid Phase Equilib. 2013;360:156. [Google Scholar]
- Zhang C. Liu B. Wang X. Wang H. Zhang H. J. Chem. Eng. Data. 2014;59(9):2732. [Google Scholar]
- Fan Y. Zhu W. Hu Y. Yang W. Xu Q. Liu X. Heng B. J. Chem. Eng. Data. 2019;64(10):4398. [Google Scholar]
- Marrero J. Gani R. Fluid Phase Equilib. 2001:183. [Google Scholar]
Associated Data
This section collects any data citations, data availability statements, or supplementary materials included in this article.