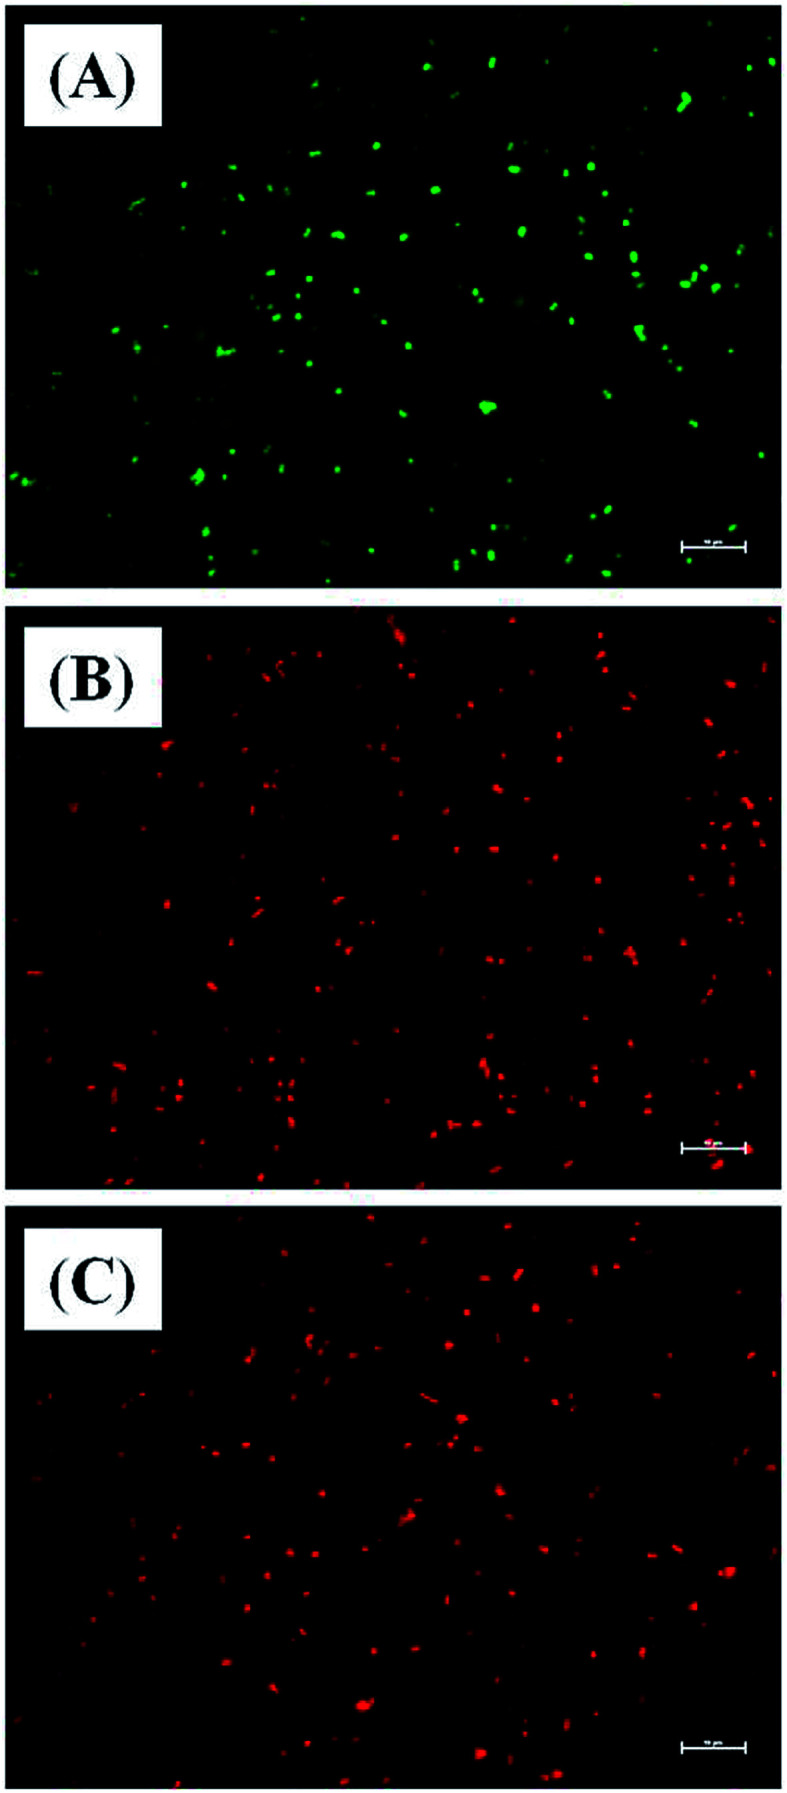
Fig. 6. Representative live and dead staining of S. iniae. (A) Untreated S. iniae, (B) S. iniae treated with 3.13 μm Md-Lec–pCuS NPs and (C) S. iniae treated with 3.13 μm Triton X 100. The cells are stained with AO and PI. Live cells show green fluorescence and dead cells shows red fluorescence. Scale bar: 10 μm.

