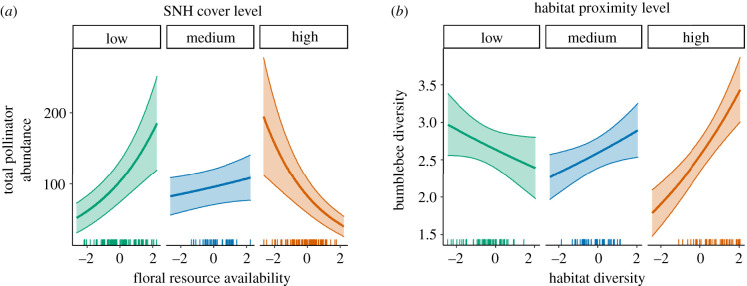
Figure 5.
Interaction plots of selected significant interactive effects of landscape drivers on (a) abundance of total insect pollinators, and (b) bumble diversity. In both graphs, the second predictor level is held constant at the first, second and third quartiles. Regression lines show the predicted abundance or diversity from the GLMM when all other predictors are held constant at mean values. Shaded areas are ±1 s.e. See electronic supplementary material, tables S11 and S13 for interaction confidence intervals.

