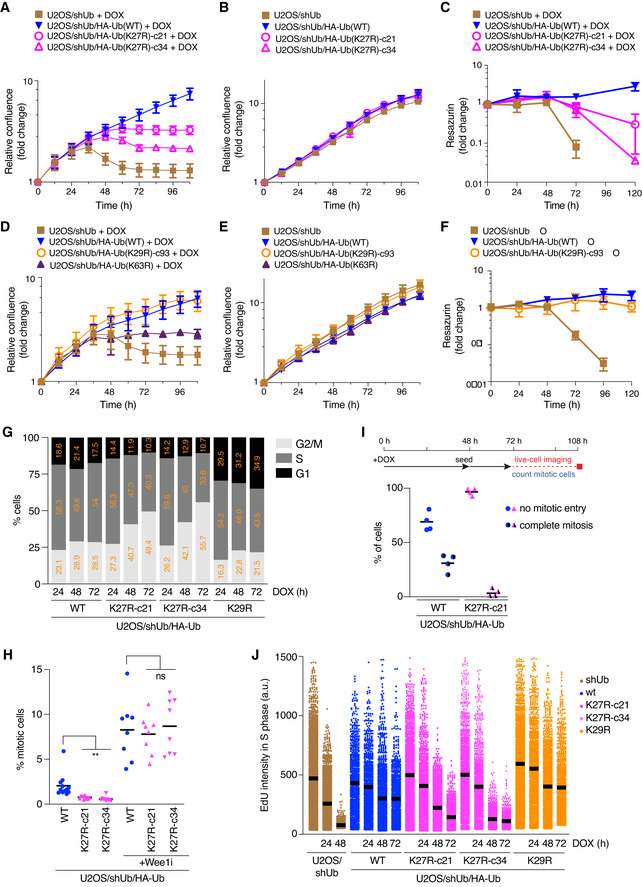
Figure 2. K27‐linked ubiquitylation is required for proliferation and viability of human cells.

-
ANormalized logarithmic proliferation quantification for U2OS/shUb, U2OS/shUb/HA‐Ub(WT) and U2OS/shUb/HA‐Ub(K27R) cell lines subjected to DOX treatment for the indicated times, as determined by Incucyte image‐based confluence analysis (mean ± SEM; n = 3 independent experiments).
-
BAs in (A), except cells were grown in the absence of DOX (mean ± SEM; n = 3 independent experiments).
-
CViability of U2OS/shUb, U2OS/shUb/HA‐Ub(WT) and U2OS/shUb/HA‐Ub(K27R) cell lines treated or not with DOX, as determined by Resazurin metabolic assay (mean ± SEM; n = 3 independent experiments).
-
DNormalized logarithmic proliferation quantification for U2OS/shUb, U2OS/shUb/HA‐Ub(WT), U2OS/shUb/HA‐Ub(K29R) and U2OS/shUb/HA‐Ub(K63R) cell lines subjected to DOX treatment for the indicated times, as determined by Incucyte image‐based confluence analysis (mean ± SEM; n = 3 independent experiments).
-
EAs in (D), except cells were grown in the absence of DOX (mean ± SEM; n = 3 independent experiments).
-
FViability of U2OS/shUb, U2OS/shUb/HA‐Ub(WT) and U2OS/shUb/HA‐Ub(K27R) cell lines treated or not with DOX, as determined by Resazurin metabolic assay (mean ± SEM; n = 3 independent experiments).
-
GCell cycle profiles of Ub replacement cell lines treated with DOX for the indicated times, pulsed with EdU and stained with HA antibody were determined by QIBC analysis of DAPI and EdU signal intensities (> 2,000 cells analyzed per condition). Cells were gated for Ub replacement based on HA signal positivity.
-
HUb replacement cells treated or not with Wee1i (1 μΜ) for 1.5 h were fixed and immunostained with H3‐pS10 antibody. Mitotic indices were determined by quantifying H3‐pS10‐positive cells using QIBC (black bars, mean; > 4,000 cells analyzed per condition; n = 8 independent experiments; **P < 0.01, ns: not significant, paired t‐test).
-
ILive‐cell imaging‐based quantification of mitotic entry in Ub replacement cell lines (bottom) treated as indicated (top) (black bars, mean; > 30 cells analyzed per condition; n = 4 independent experiments).
-
JDNA synthesis rates of Ub replacement cell lines in (G) were analyzed by quantifying EdU signal intensity in S phase cells using QIBC (black bars, mean (a.u., arbitrary units); > 1,000 S phase cells analyzed per condition).
Data information: Data (G,J) are representative of three independent experiments with similar outcome.
