
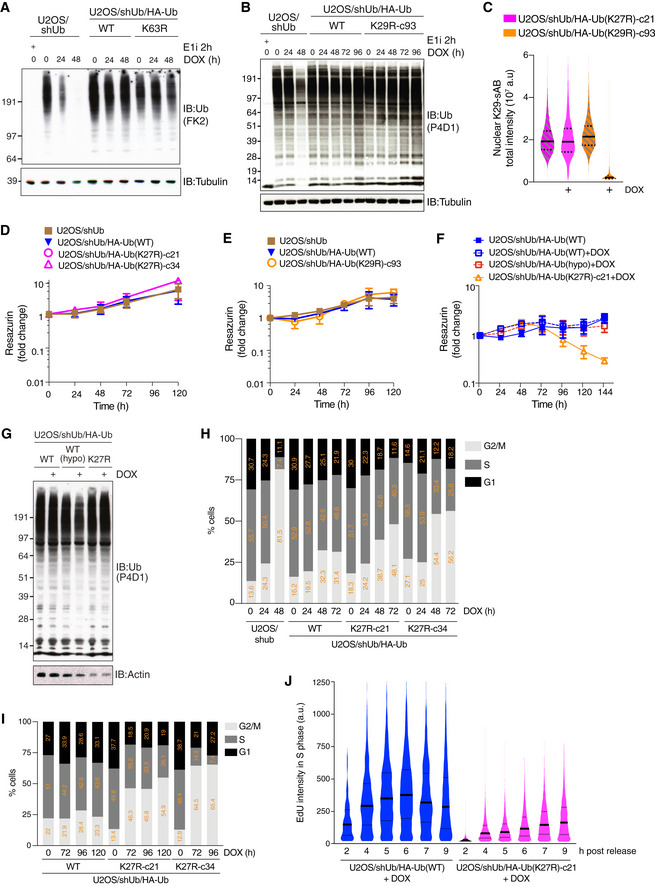
Figure EV2. (related to Fig 2) K27‐linked ubiquitylation is required for cell proliferation and cell cycle progression.
-
A, BImmunoblot analysis of U2OS/shUb and U2OS/shUb/HA‐Ub cell lines treated with DOX for the indicated times or Ub E1 inhibitor (E1i) for 1 h.
-
CU2OS/shUb/HA‐Ub replacement cell lines were treated with DOX for 72 h where indicated, fixed and stained with K29‐Ub specific synthetic antigen binder sAB‐K29 (Yu et al, 2021). Levels of K29‐Ub conjugates were quantified using QIBC (solid lines, median; dashed lines, quartiles (a.u., arbitrary units); > 5,000 cells analyzed per condition).
-
DViability of U2OS/shUb, U2OS/shUb/HA‐Ub(WT) and U2OS/shUb/HA‐Ub(K27R) cell lines without DOX treatment, as determined by Resazurin metabolic assay (mean ± SEM; n = 3 independent experiments).
-
EAs in (D), but U2OS/shUb, U2OS/shUb/HA‐Ub(WT) and U2OS/shUb/HA‐Ub(K29R) cell lines are shown. (mean ± SEM; n = 3 independent experiments).
-
FAs in (D), but U2OS/shUb/HA‐Ub(WT), U2OS/shUb/HA‐Ub(K27R) and U2OS/shUb/HA‐Ub(WT hypomorph) cell lines with or without DOX treatment are shown (mean ± SEM; n = 3 independent experiments).
-
GImmunoblot analysis of U2OS/shUb/HA‐Ub(WT), U2OS/shUb/HA‐Ub(WT hypomorph) and U2OS/shUb/HA‐Ub(K27R) cell lines treated or not with DOX for 72 h.
-
H, ICell cycle profiles of Ub replacement cell lines treated with DOX for the indicated times were determined by QIBC analysis of DAPI and either EdU (H) or PCNA (I) signal intensities (> 2,000 cells analyzed per condition).
-
JQuantification of EdU incorporation in DOX‐treated Ub replacement cell lines at the indicated times after release from a single thymidine block (solid lines, median; dashed lines, quartiles; > 2,000 S phase cells analyzed per condition).
Data information: Data are representative of five (H,I) and three (A‐C,G,J) independent experiments.