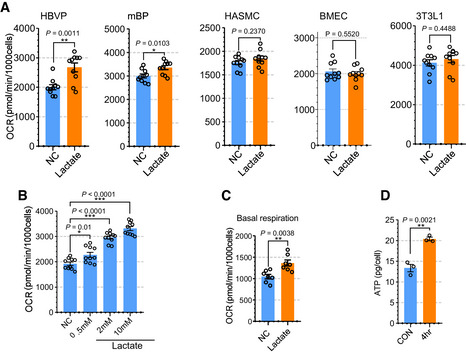
Quantification of oxygen consumption rate (OCR) showing the effect of lactate treatment on the respiration (induced) in various cells including HBVP, mBP, HASMC, BMEC and 3T3L1. The media was changed into glucose‐, pyruvate‐ and glutamine‐free media before OCR measurement and lactate (2 mM) was added the media to measure induced OCR. (n = 10 from independent experiments. Error bars indicate the standard error of the mean (SEM) from unpaired Student’s t test).
Quantification of OCR showing the effect of lactate dose dependent treatment (0.5, 2, and 10 mM) in HBVPs. (n = 9 from independent experiments. Error bars indicate the standard error of the mean (SEM)).
Quantification of OCR (basal respiration) with full media (5 mM glucose, 0.5 mM pyruvate and 0.5 mM glutamine) showing the effect of lactate treatment (2 mM) in HBVPs. (n = 7 from independent experiments. Error bars indicate the standard error of the mean (SEM) from unpaired Student’s t test).
Quantification of ATP using a LC‐MS/MS spectrometry in control and lactate treated (2 mM, 4 h) HBVPs (n = 3 from independent experiments. Error bars indicate the standard error of the mean (SEM) from unpaired Student’s t test).