-
A
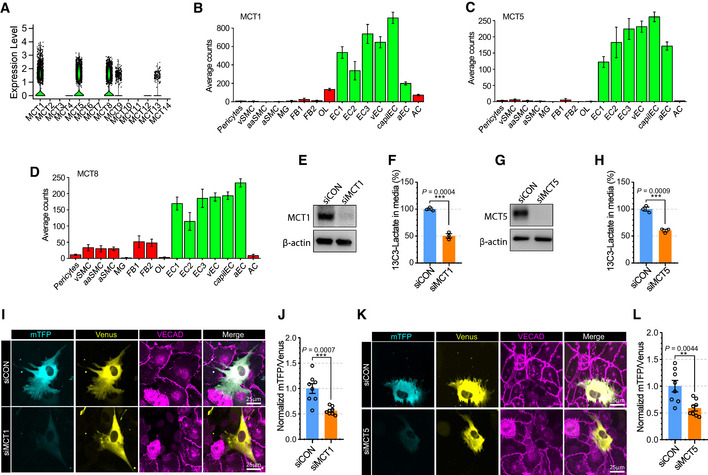
Violin plot showing the expression of Slc16a family members (monocarboxylate transporters) in brain endothelial cells from scRNAseq database (EndoDB; 3,755 endothelial cells).
-
B–D
Barplots showing the expression of B) MCT1 (Slc16a1), C) MCT5 (Slc16a4) and D) MCT8 (Slc16a2) across brain cells from the scRNAseq database (Brain cell atlas) (vSMC: venous smooth muscle cells, aaSMC: arteriolar SMCs, aSMC: arterial SMCs, MG: Microglia, FB1‐2: Fibroblast subtypes, OL: Oligodendrocytes, EC1‐3: EC subtypes, vEC: venous ECs, capiEC: capillary ECs, aEC: arterial ECs, AC: astrocytes) (1,100 endothelial cells, mean ± SD).
-
E
Western blot analysis for siRNA efficiency of MCT1.
-
F
Quantification of 13C3‐Lactate using LC‐MS/MS in media of siCON or siSlc16a1 treated BMECs after 13C6‐glucose treatment (12 h). (n = 3 from independent experiments. Error bars indicate the standard error of the mean (SEM) from unpaired Student’s t test).
-
G
Western blot analysis for siRNA efficiency of MCT12.
-
H
Quantification of 13C3‐Lactate using LC‐MS/MS in media of siCON or siSlc16a4‐treated BMECs after 13C6‐glucose treatment (12 h). (n = 3 from independent experiments. Error bars indicate the standard error of the mean (SEM) from unpaired Student’s t test).
-
I
Representative images showing mTFP (cyan) and Venus (yellow) fluorescence in HBVPs which have direct contact with control (upper panel) or MCT1 (lower panel) siRNA‐treated BMECs. VECAD immunostaining was used for endothelial staining.
-
J
Quantification of the mTFP/Venus fluorescence ratio of laconic in HBVPs which have direct contact with control (siCON) or MCT1 (siMCT1) siRNA‐treated BMECs. (n = 8 from independent experiments. Error bars indicate the standard error of the mean (SEM) from unpaired Student’s t test).
-
K
Representative images showing mTFP (cyan) and Venus (yellow) fluorescence in HBVPs which have direct contact with control (upper panel) or MCT5 (lower panel) siRNA‐treated BMECs. VECAD immunostaining was used for endothelial staining.
-
L
Quantification of the mTFP/Venus fluorescence ratio of laconic in HBVPs which have direct contact with control (siCON) or MCT5 (siMCT5) siRNA‐treated BMECs (n = 8 from independent experiments. Error bars indicate the standard error of the mean (SEM) from unpaired Student’s t test).