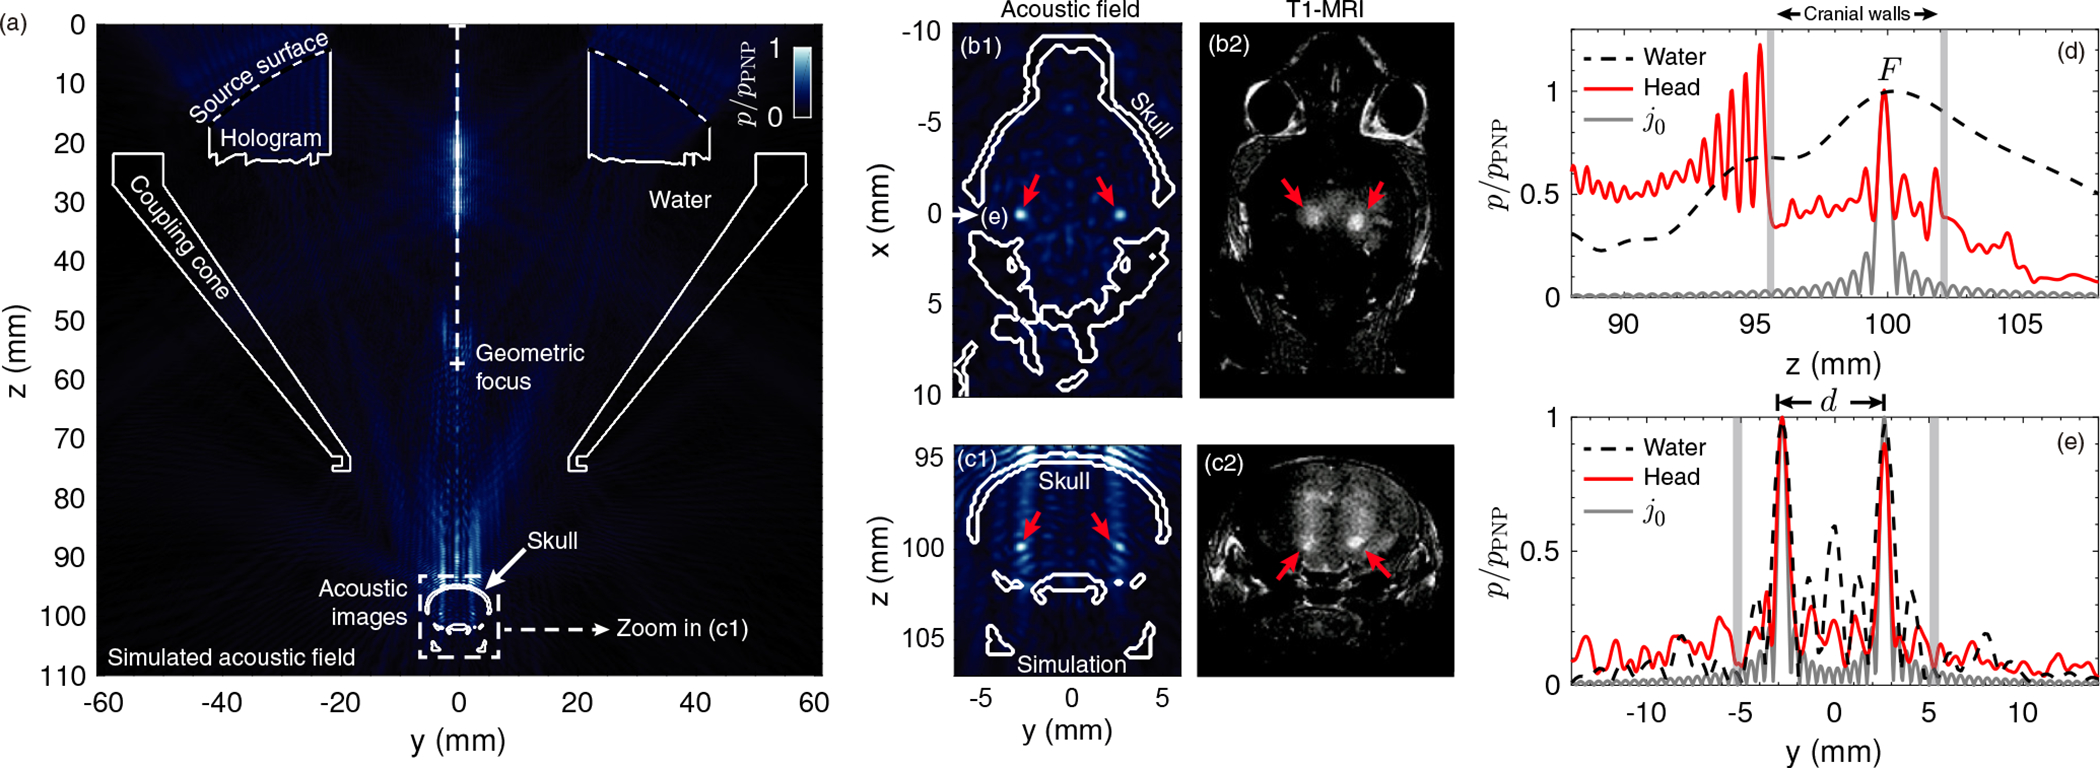
Fig. 3:

Pressure field distribution (normalized PNP) simulation compared to the BBB opening regions. (a) Simulated axial pressure-field distribution plane at x = 0 mm. The contours of the lens, cone and skull are shown in a continuous-white line. (b1,c1) Simulated transversal (at z = 100 mm) and axial (zoom in of (a) at x = 0 mm) pressure-field distribution planes, respectively, showing the two focused spots by red arrows. (b2,c2) Experimental transversal and axial T1-MRI planes, respectively, showing the two BBB openings, in light color, by red arrows. (d) Simulated axial cross-section of the calibration case (dashed-black line) and the transcranial case (continuous-red line) showing the pressure-field distribution at y = 2.6 mm and x = 0 mm. A spherical Bessel function of the first kind and zero-th order centered at the focal spot is shown in a continuous-gray line. (e) Simulated transversal cross-section of the calibration case (dashed-black line) and the transcranial case (continuous-red line) showing the pressure-field distribution at z = 100 mm and x = 0 mm. A spherical Bessel function of the first kind and zero-th order centered at the two focal spots is shown in a continuous-gray line.
