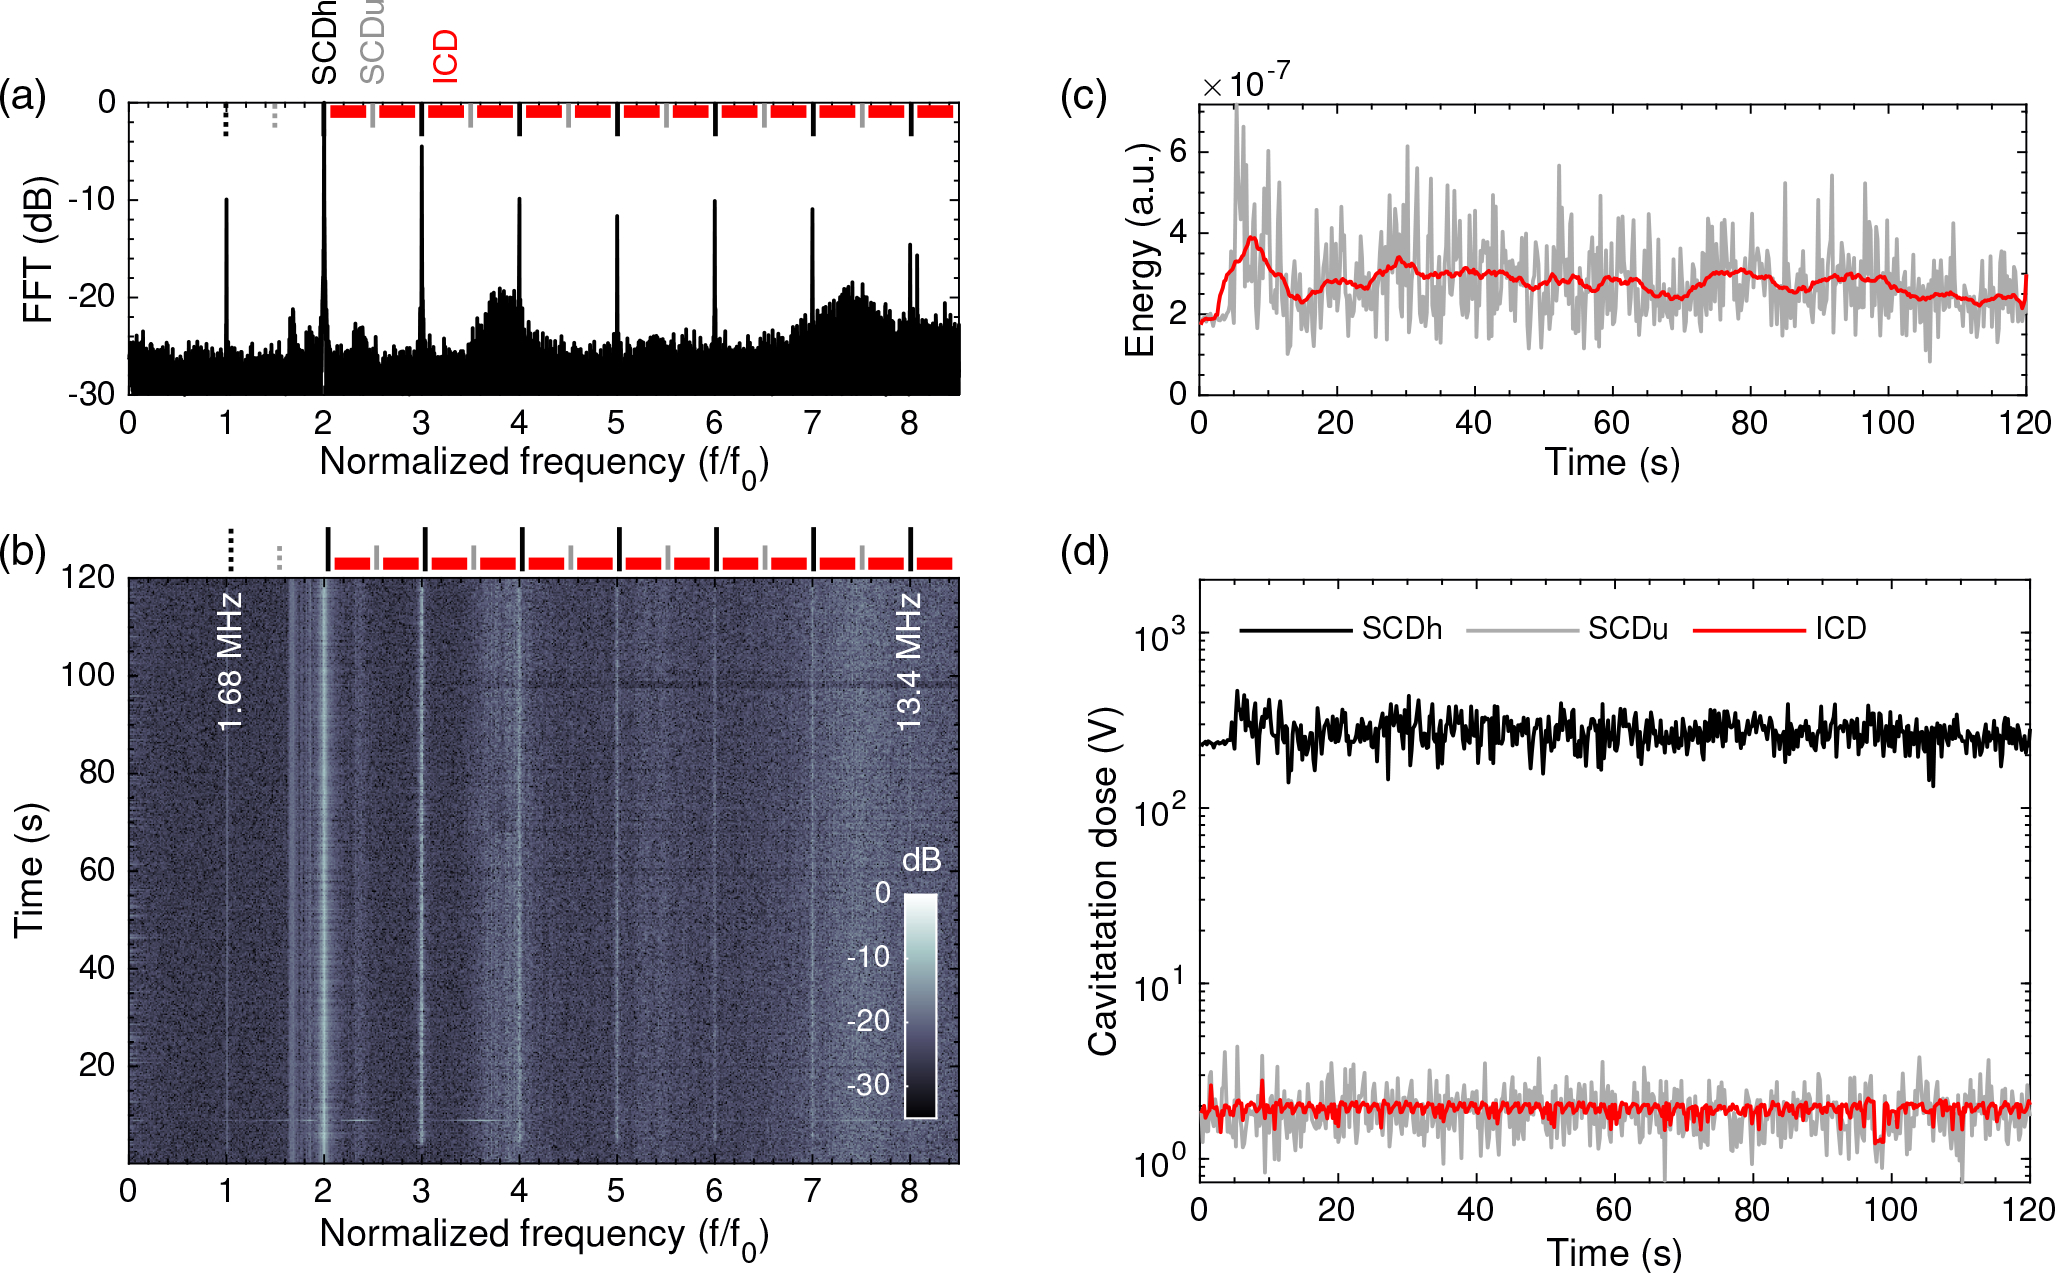
Fig. 4:

In vivo microbubble emission analysis over sonication time. (a) Normalized amplitude of the Fast Fourier Transform (FFT) performed over the cavitation emissions produced by a single pulse. (b) Spectrogram showing the evolution of the harmonics n = 1, 2, 3, 4, 5, 6, 7. (c) Energy evolution during the entire treatment (gray) and energy using a 5-second moving average filter. (d) Stable harmonic (black), stable ultraharmonic (gray), and inertial (red) cavitation doses.
