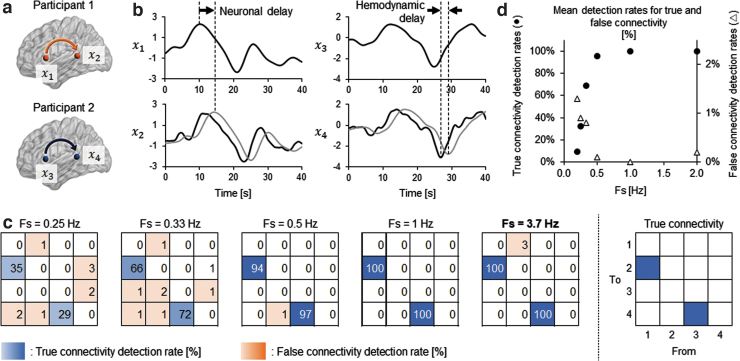
FIG. 3.
Simulation summary investigating detectability of Granger causal relationship with fNIRS data. (a) Causal relationship was assumed between two ROIs in each of two brains. (b) Example of simulated fNIRS signals. Signals at the receiver ROIs (gray lines in x2 and x4) were assumed to have neuronal delay from those at the sender ROIs (x1 and x3) for information transmission. The signals at the receiver ROIs were further shifted back to opposing direction of the neuronal delay (black lines in x2 and x4) to simulate the worst-case scenario leading to the underestimation of causal relationship. Gaussian noise was further added to these simulated signals for the GC analysis. (c) Heat maps showing the ratio of correctly (blue panels) or incorrectly (orange panels) detected Granger causal relationship with varied sampling Fs of the data. The number in each cell indicates the percentage of detecting valid GC among 100 trials of simulation. At the sampling rate of the original fNIRS GC analysis (Fs = 3.7 Hz), the assumed directional connectivity was perfectly detected, while the false detection was scarce. (d) Changes of mean detection rates for true and false connectivity with different sampling frequencies. The mean detection rates were calculated as the average occurrence ratio of valid GC over true (from x1 to x2 and from x3 to x4: filled circles) or false (the other pairs of ROIs: open triangles) combinations of signals. Fs, frequencies; ROIs, regions of interest.

